
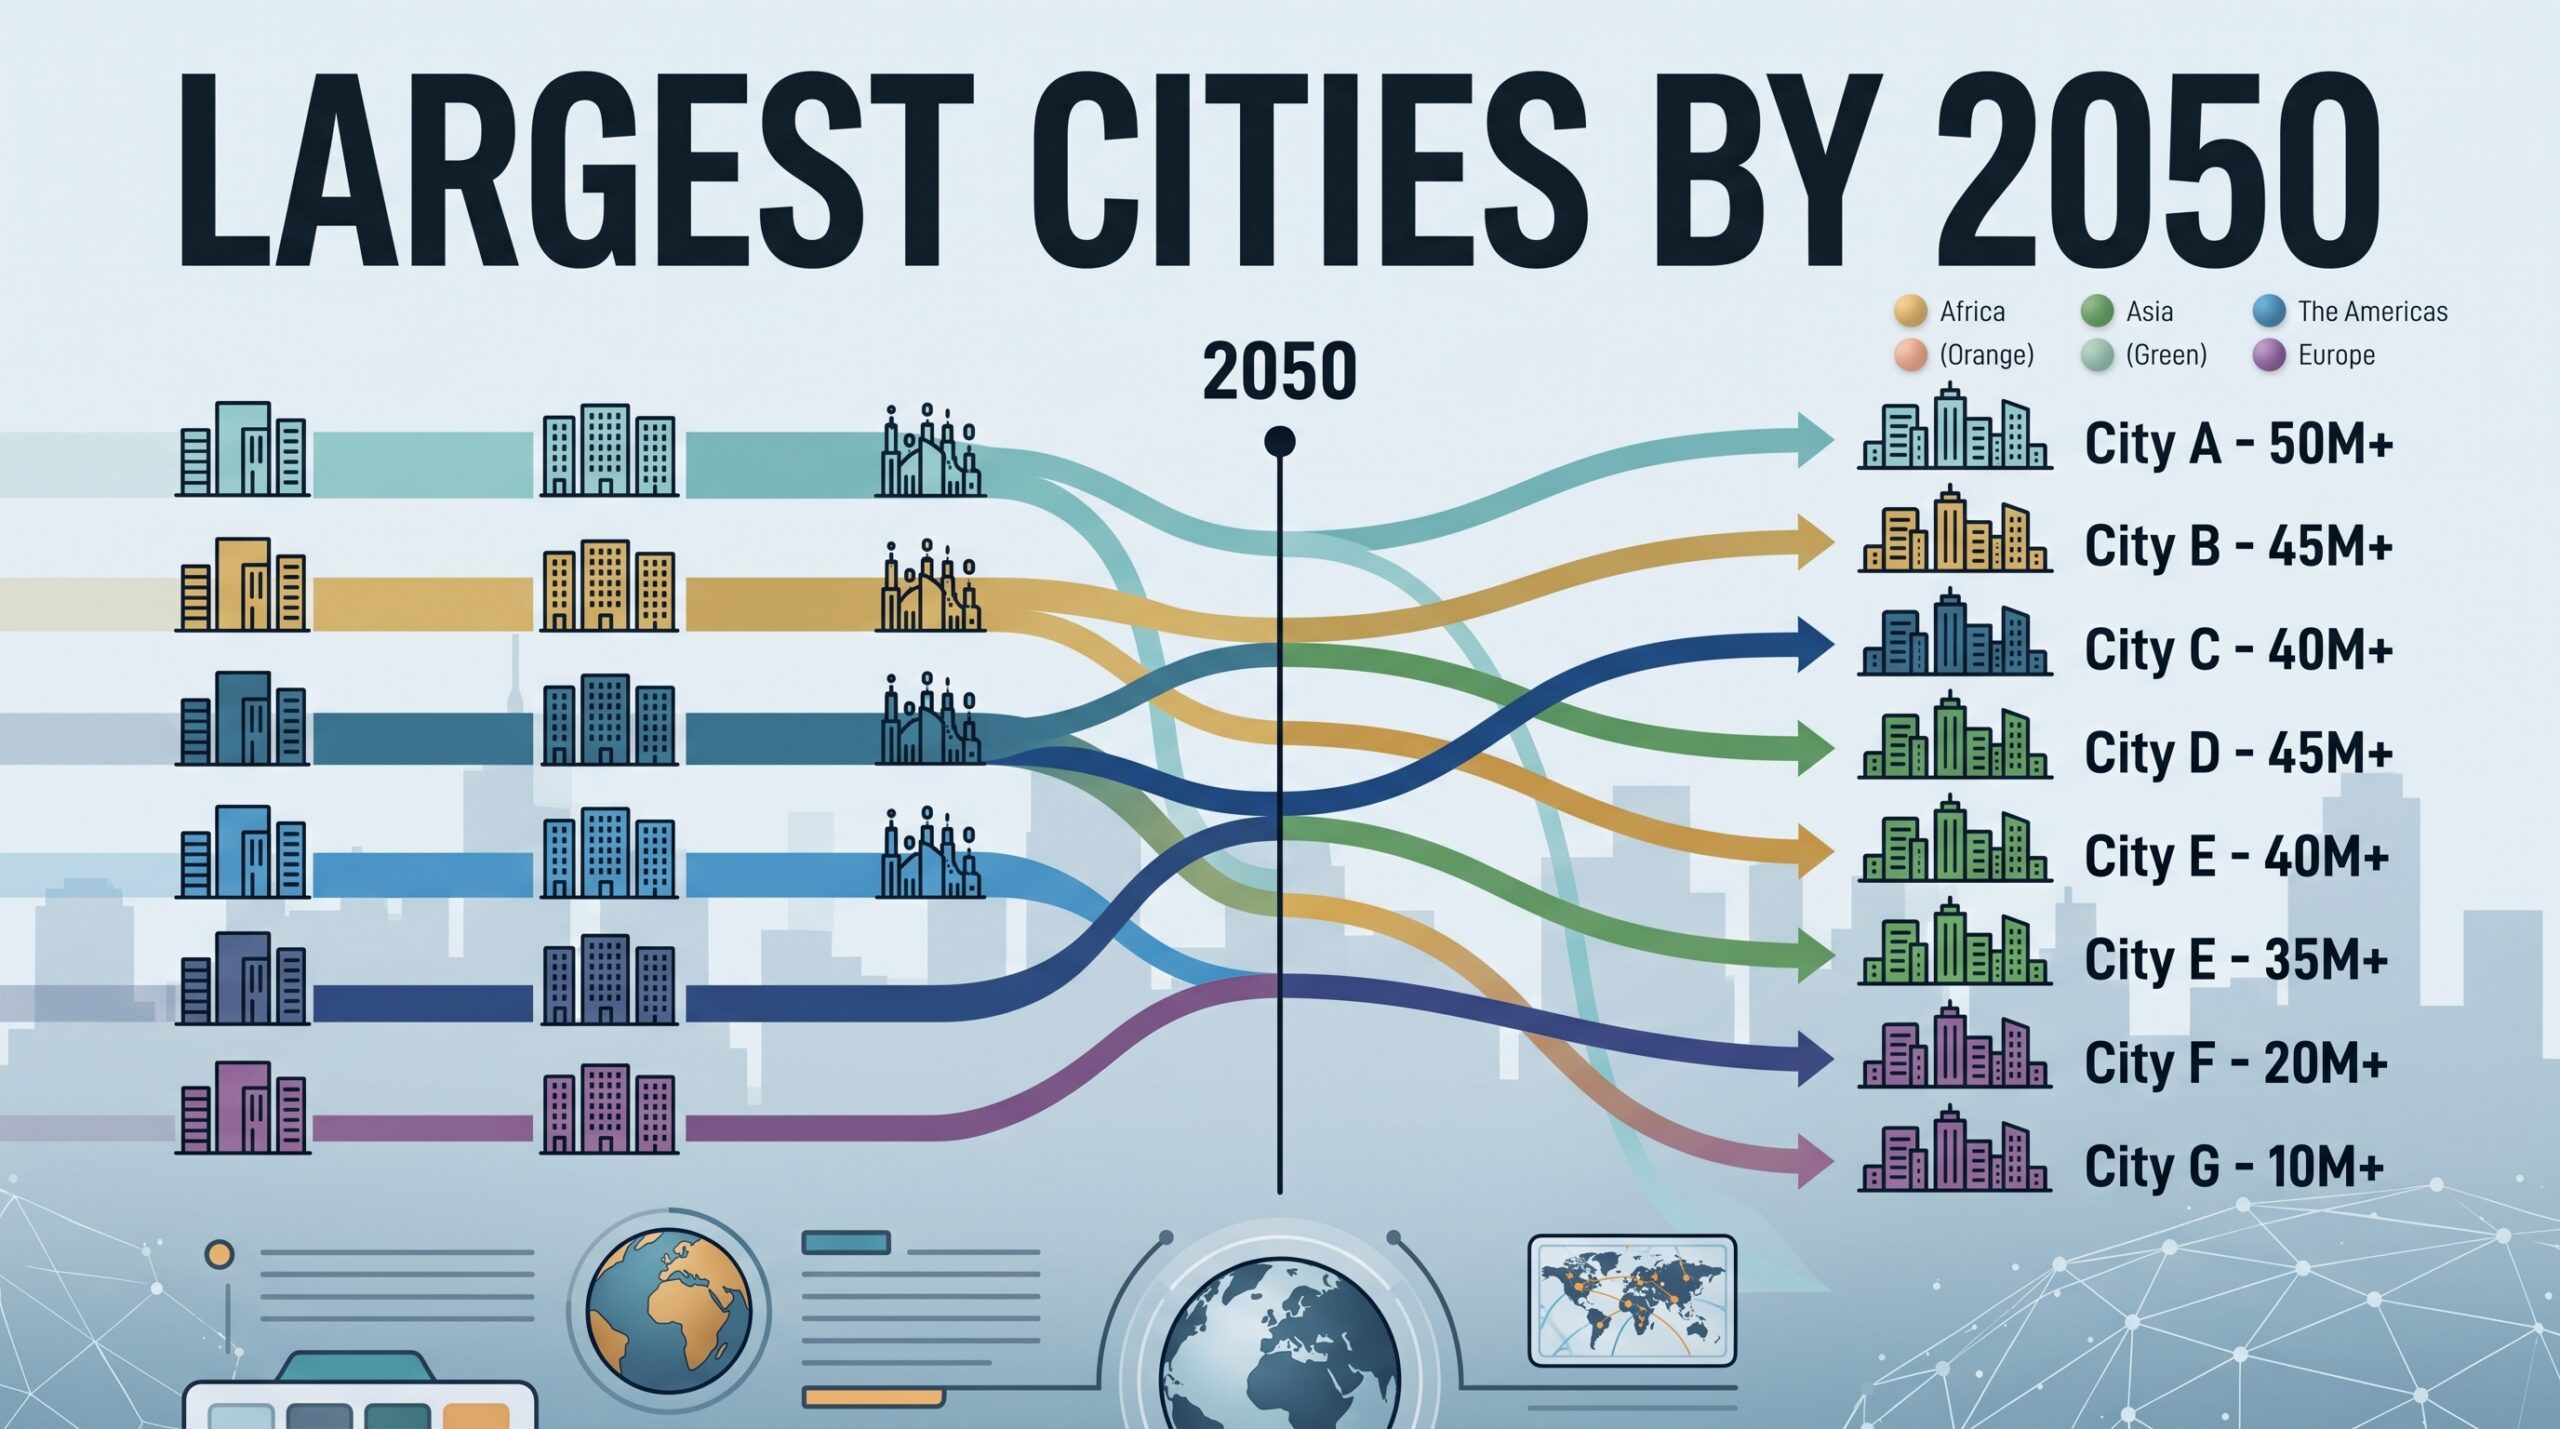
By 2050, demographic projections show massive shifts in where humans live. Emerging megacities FMCG retail trends 2050 indicate Dhaka will surge past 52 million residents, Jakarta will hit nearly 50 million, and cities like Karachi, Cairo, and Manila will reach unprecedented densities. By 2100, the top 15 largest cities on Earth will be located entirely across Asia and Africa.
Retail executives look at these demographic charts and make a quick assumption: massive population growth automatically translates into consumer goods revenue.
That assumption is dangerous.
Population is not purchasing power. Headcount is not profit. If you plan to expand a consumer packaged goods brand into these regions based purely on population tables, you risk burning capital.

Source: Visual Capitalist
The World’s Largest Cities (1950–2100P)
Historical estimates and UN/JRC projections (click to expand)
The World’s Largest Cities (1950–2100P)
Historical estimates and UN/JRC projections (click to expand)
| # | 1950 | 1975 | 2000 | 2025P | 2050P | 2075P | 2100P |
|---|---|---|---|---|---|---|---|
| 1 | Tokyo12.6M |
Tokyo24.3M |
Tokyo30.3M |
Jakarta41.9M |
Dhaka52.1M |
Dhaka57.9M |
Dhaka55.0M |
| 2 | NYC9.3M |
Osaka14.4M |
Jakarta25.6M |
Dhaka36.6M |
Jakarta51.8M |
Jakarta52.9M |
Jakarta49.7M |
| 3 | Osaka8.0M |
NYC12.1M |
Guangzhou19.0M |
Tokyo33.4M |
Shanghai34.9M |
Karachi40.8M |
Karachi43.7M |
| 4 | London7.9M |
Jakarta11.7M |
Seoul19.0M |
New Delhi30.2M |
New Delhi33.9M |
Cairo35.7M |
Cairo36.7M |
| 5 | Kolkata6.1M |
Mexico City11.1M |
Kolkata18.4M |
Shanghai29.6M |
Karachi32.6M |
New Delhi34.2M |
New Delhi32.0M |
| 6 | Moscow5.5M |
São Paulo10.5M |
New Delhi18.0M |
Guangzhou27.6M |
Cairo32.4M |
Shanghai31.8M |
Luanda30.7M |
| 7 | Paris5.4M |
Kolkata10.5M |
Manila17.8M |
Cairo25.6M |
Tokyo30.7M |
Luanda27.3M |
Lahore24.8M |
| 8 | Buenos Aires4.6M |
Seoul10.1M |
Mexico City17.6M |
Manila24.7M |
Guangzhou29.2M |
Tokyo26.6M |
Shanghai24.7M |
| 9 | Los Angeles4.0M |
Buenos Aires8.6M |
Dhaka17.4M |
Kolkata22.5M |
Manila27.1M |
Manila25.8M |
Tokyo24.1M |
| 10 | Jakarta3.9M |
Moscow8.5M |
São Paulo16.7M |
Seoul22.5M |
Kolkata23.8M |
Guangzhou24.8M |
Manila22.4M |
| 11 | Mumbai3.8M |
Mumbai8.3M |
Mumbai16.0M |
Karachi21.4M |
Mumbai23.1M |
Lahore23.7M |
Mumbai21.5M |
| 12 | Mexico City3.7M |
Manila8.3M |
Cairo15.7M |
Mumbai20.2M |
Seoul21.2M |
Mumbai23.1M |
Kolkata20.5M |
| 13 | Cairo3.1M |
Los Angeles7.7M |
Osaka14.5M |
São Paulo18.9M |
Bangkok20.5M |
Kolkata22.8M |
Dar es Salaam20.1M |
| 14 | Shanghai3.1M |
Cairo7.4M |
Shanghai14.0M |
Bangkok18.2M |
Lahore20.4M |
Bangkok19.4M |
Guangzhou18.1M |
| 15 | São Paulo3.1M |
Paris7.4M |
NYC13.0M |
Mexico City17.7M |
Luanda20.3M |
Ho Chi Minh17.9M |
Lagos17.9M |
The Economics of Emerging Megacity Retail: Volume vs. Real Cash
Entering a market of 50 million people sounds like a massive commercial opportunity. But you must look past top-line volume to evaluate unit economics, margin retention, and operating overhead.
The Sachet Unit Economics Problem
In low-income urban clusters, the majority of the population does not buy 500ml shampoo bottles or family-sized cereal boxes. They purchase single-serve sachets and micro-packs priced at 5 to 15 cents.
- Microscopic Contribution Margins: When an item retails for $0.10, the gross profit per unit is measured in fractions of a cent.
- Volume Requirements: You must manufacture, pack, move, and track millions of units each month just to pay for factory power, local sales staff, and office overhead.
- Working Capital Lockup: Managing high unit counts requires substantial inventory across long supply chains, tying up capital for minimal returns.
Absolute Dollar Return vs. Market Share Percentage
A mature European or North American market often looks unappealing on a pitch slide because annual population growth is flat. But the absolute dollar return tells a completely different story:
- A 0.2% market share in Germany or the UK for an everyday consumer product delivers higher absolute cash flow and gross profit than a 10% market share in a volatile, low-margin urban market.
- Advanced markets feature clear billing, fast inventory turns, automated distribution centers, and reliable payment terms. Emerging megacities require manual credit collection and fragmented distribution routes.
5 Operational Roadblocks for Retail Brands in Global Megacities
Scaling consumer goods in dense urban markets comes with distinct operational hurdles that do not exist in Western retail environments.
1. The Micro-Logistics Distribution Bottleneck
Western logistics models rely on semi-trucks, palletized shipments, and centralized distribution hubs supplying organized supermarkets. That setup fails in dense megacities.
- Gridlock and Poor Infrastructure: Delivering across dense, unmapped urban zones cannot be done efficiently with standard delivery vans.
- The Traditional Trade (TT) Reality: Up to 80% of retail sales run through informal trade—small corner shops, open-market stalls, and independent roadside kiosks (warungs in Indonesia, mudir dokans in Bangladesh, sari-sari stores in the Philippines).
- Two-Wheeler Distribution Networks: Supplying hundreds of thousands of independent kiosks requires fleets of motorcycles and local sub-distributors.
- Margin Drain: The extra layers of micro-distributors cut distribution margins down to 2% to 4%, leaving zero margin for error.
2. Packaging Costs vs. Environmental Regulations
Single-serve packaging carries a fundamental manufacturing flaw: packaging materials represent a disproportionate share of the total cost of goods sold (COGS).
- High Packaging-to-Product Ratio: Foil laminates, multi-layer plastics, and small seals cost more per gram of product than large bulk containers.
- Plastic Bans and EPR Mandates: Local governments facing waste management crises are passing Extended Producer Responsibility (EPR) laws and single-use plastic bans. Brands must either switch to expensive biodegradable materials or pay heavy municipal waste fines.
3. Deeply Entrenched Domestic Conglomerates
International brands often underestimate the strength of local competitors.
- Local Supply Control: Companies like PRAN in Bangladesh or Indofood in Indonesia have spent decades securing local raw material supplies, domestic processing plants, and strong relationships with municipal authorities.
- Low-Cost Operational Bases: Local players run lower overheads and accept single-digit net margins that international public corporations cannot justify to shareholders.
- Unmatched Kiosk Loyalty: Local field reps visit mom-and-pop kiosks weekly, extending informal credit and resolving inventory issues on the spot.
4. Currency Devaluation and Import Vulnerability
Consumer goods businesses generate cash in the local currency, but key capital expenditures remain dollar- or euro-denominated.
- The FX Trap: You sell products in Bangladeshi Taka or Indonesian Rupiah. However, factory equipment, spare parts, active ingredients, and base packaging inputs are priced in hard currencies ($USD or €EUR).
- Margin Wipeout: A sudden 15% to 25% currency devaluation instantly wipes out your operating margin. You cannot raise retail sachet prices from 10 cents to 13 cents without losing price-sensitive shoppers to local alternatives.
5. Credit Defaults and Cash-Flow Leaks
Selling to thousands of independent mom-and-pop shops comes with high counterparty risk.
- Informal Credit Lines: Corner kiosks operate on minimal daily working capital. To get your product on their shelf, local distributors often have to front goods on credit.
- Receivables Risk: When consumer demand slows, recovering receivables from thousands of micro-retailers becomes difficult, resulting in inventory write-offs and bad debt.
Market Entry Strategy: How FMCG Brands Can Compete
Standard export tactics and building large, Western-style hypermarkets will not deliver long-term returns in these environments. If you want to build a viable business in high-density growth markets, use one of three entry strategies:
- Domestic Contract Manufacturing: Manufacture products locally to avoid import tariffs, reduce ocean freight costs, and mitigate currency exchange risks on finished goods.
- Local Joint Ventures (JVs): Partner with established domestic operators. You provide brand equity, formulations, and quality control; the local partner handles route-to-market logistics, regional compliance, and field sales execution.
- Acquiring Established Domestic Heritage Brands: Buy an existing local brand with functional manufacturing infrastructure, regional distributor contracts, and everyday shelf presence. Optimize their production line rather than building a brand from zero.
Frequently Asked Questions (FAQ)
What is the biggest mistake FMCG brands make in emerging megacities?
The most common mistake is treating population size as guaranteed product demand. Brands often import standard Western package sizes and premium price points, ignoring the dominant role of traditional corner kiosks and the low purchasing power of daily wage earners.
Why is traditional trade dominant over modern supermarkets in these regions?
Traditional trade thrives on proximity, convenience, and community relationships. Independent corner kiosks allow urban residents to purchase small daily items within walking distance of their homes, frequently on informal short-term credit.
How does currency devaluation directly hurt consumer goods margins?
Revenue is collected in the local currency, but manufacturing equipment, specialized raw ingredients, and packaging materials are priced in hard foreign currencies. When the local currency loses value, operating costs surge, but consumer price sensitivity makes it difficult to raise shelf prices without losing sales volume.


Leave a Reply