
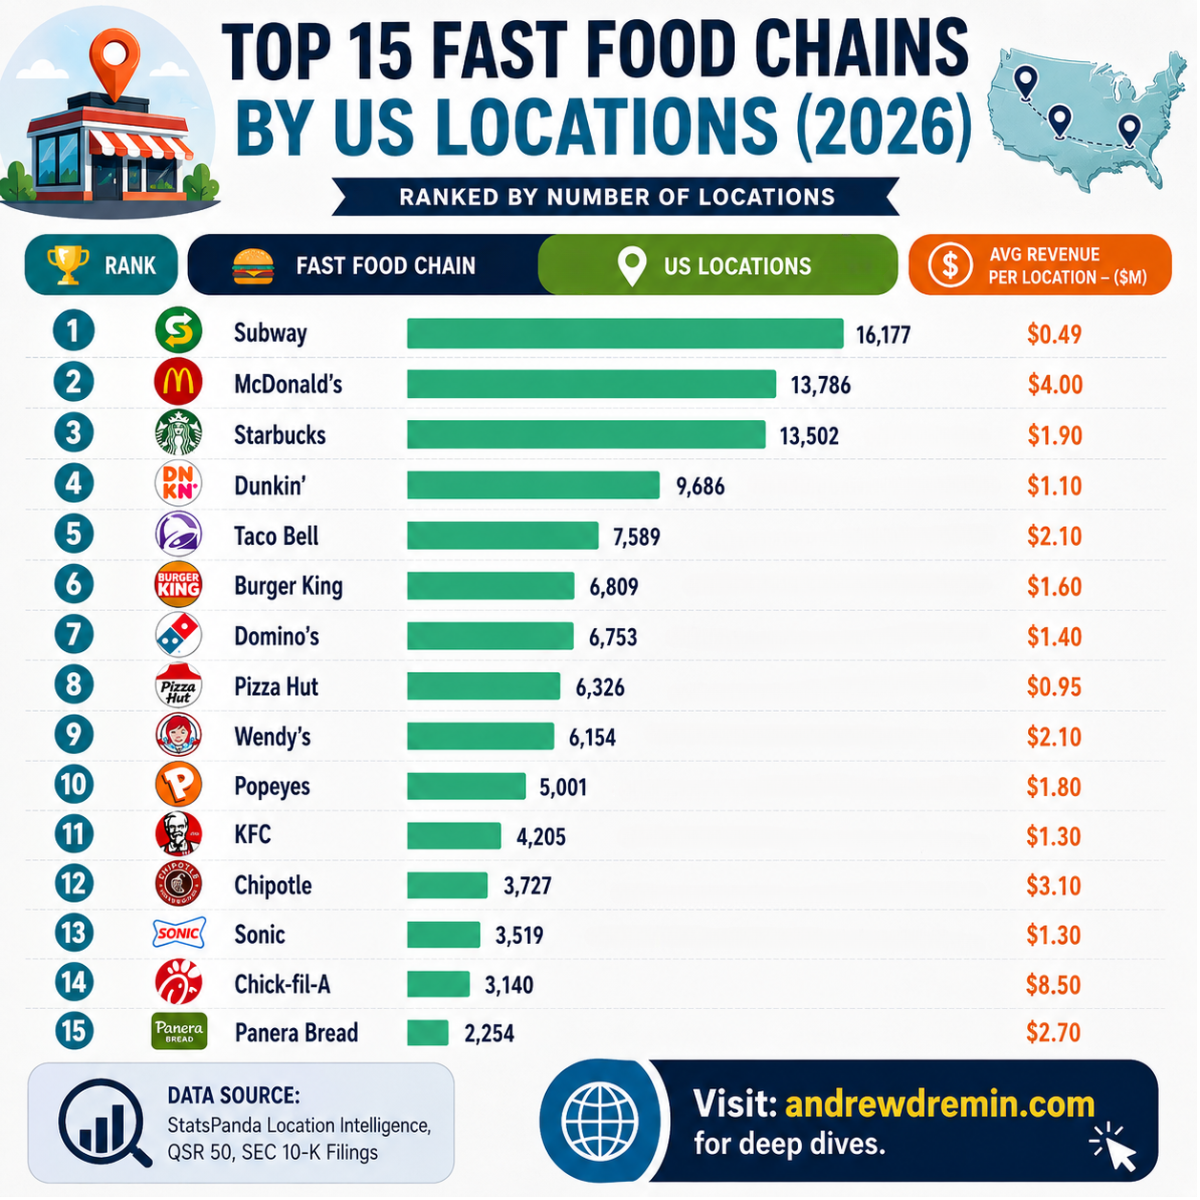
Chick-fil-A makes approximately $8.50M per store per year while operating only six days a week. Subway averages $0.49M ($490,000) per store.
Looking at store count alone paints a misleading picture. Subway leads the United States with 16,177 locations, whereas Chick-fil-A operates just 3,140 locations.
A business built on 16,000 low-volume locations is fundamentally different from a business built on 3,000 ultra-high-volume locations. Comparing them on location count alone ignores the underlying unit economics:
- Subway Total US System Revenue: 16,177 x $0.49M = $7.93B$
- Chick-fil-A Total US System Revenue: 3,140 x $8.50M = $26.69B$
Chick-fil-A generates more than triple Subway’s total domestic system revenue with less than one-fifth of the store footprint.
Fast Food Franchise Models: Capex, Footprint, and Operator Economics
The Subway Franchise Model: Low Capex, High Footprint, High Risk for Operators
Subway grew rapidly because it created one of the lowest barriers to entry in franchise history:
- Initial Capital Expenditure (Capex): Historically $200,000 to $300,000 per store.
- Physical Footprint: Around 1,000 square feet in strip malls, subway stations, airports, and gas stations.
- Kitchen Infrastructure: No complex fryers or commercial hood systems; assembly lines handle mostly cold prep and speed ovens.
- Corporate Revenue Engine: Subway corporate collected franchise fees and top-line royalties (~8% royalty plus 4.5% advertising fee) on gross sales.
Under this model, corporate generated revenue regardless of individual unit profitability. If a new Subway opened two blocks away from an existing one, corporate total revenue grew even if the older store lost 20% of its sales. Franchisees bore the financial burden of market saturation and low foot traffic.
Subway Model:
The Chick-fil-A Operating Model: Corporate Real Estate, High Capex, Extreme Throughput
Chick-fil-A uses a tightly controlled, high-investment operator structure:
- Initial Capital Expenditure (Capex): Typically exceeds $3M to $5M+ per location.
- Physical Footprint: Large standalone lots, dedicated double drive-thru lanes, multilane ordering canopies, and kitchen lines sized for high volume.
- Labor Deployment: 30 to 50+ team members per shift during peak hours to manage continuous drive-thru and dining room flow.
- Real Estate & Operator Structure: Chick-fil-A corporate buys or leases the land, builds the facility, and buys the equipment. Operators pay an initial fee of around $10,000 and undergo a selective vetting process (less than 1% acceptance rate). Corporate takes a larger share of net profits (typically 50% after base fees), directly aligning franchisor incentives with individual store profitability.
Chick-fil-A Model
Average Unit Volume Analysis: What the Top 15 Fast Food Chains Reveal
The 2026 US fast-food footprint data reveals a clear split between chains prioritizing rapid location growth and those optimizing for Average Unit Volume (AUV).
| Fast Food Chain | US Locations | Average Revenue Per Location ($M) | Core Operating Strategy |
| Chick-fil-A | 3,140 | $8.50 | High capex, dual drive-thru throughput, tight menu |
| McDonald’s | 13,786 | $4.00 | Massive system scale, premium real estate, dual drive-thru |
| Chipotle | 3,727 | $3.10 | High-speed assembly line, focused Mexican grill menu |
| Panera Bread | 2,254 | $2.70 | Higher average ticket, bakery-cafe dine-in and digital pickup |
| Taco Bell | 7,589 | $2.10 | High ingredient cross-utilization, late-night drive-thru |
| Wendy’s | 6,154 | $2.10 | Drive-thru focused, burger & breakfast volume |
| Starbucks | 13,502 | $1.90 | High frequency, small footprints, dense urban & suburban presence |
| Popeyes | 5,001 | $1.80 | Fried chicken platform, drive-thru and delivery mix |
| Burger King | 6,809 | $1.60 | Traditional QSR burger model, drive-thru dependent |
| Domino’s | 6,753 | $1.40 | Delivery-first, small square footage, minimal front-of-house |
| KFC | 4,205 | $1.30 | Chicken bucket meals, strip mall & standalone formats |
| Sonic | 3,519 | $1.30 | Drive-in carhop model, beverage/snack frequency |
| Dunkin’ | 9,686 | $1.10 | Morning beverage & bakery focus, low average ticket |
| Pizza Hut | 6,326 | $0.95 | Legacy dine-in overhead transitioning to delivery/carryout |
| Subway | 16,177 | $0.49 | Low-cost franchise expansion, high local store density |
Source: Stats Panda
High-Volume vs Low-Volume QSR Breakdown
- Throughput Leaders ($3.0M+ AUV): Chick-fil-A ($8.50M), McDonald’s ($4.00M), and Chipotle ($3.10M). These brands run standardized operational setups designed to move large numbers of customers through assembly lines or drive-thrus per hour.
- Mid-Tier Workhorses ($1.5M to $2.9M AUV): Panera Bread ($2.70M), Taco Bell ($2.10M), Wendy’s ($2.10M), Starbucks ($1.90M), and Popeyes ($1.80M). These rely on balanced customer tickets, steady daypart coverage, and streamlined production.
- Low-Ticket / High-Density Formats (Under $1.5M AUV): Domino’s ($1.40M), KFC ($1.30M), Sonic ($1.30M), Dunkin’ ($1.10M), Pizza Hut ($0.95M), and Subway ($0.49M). These concepts lean on low buildout costs, compact square footage, or high location counts to make the broader network viable.
Retail and FMCG Strategy: Why Sales Velocity Always Beats Door Count
A common error in FMCG and retail management is treating distribution reach as the primary success metric. Expanding store count without underlying customer pull creates operational drag.
- High inventory holding costs & working capital tie-up
- Stagnant stock and expired products on shelves
- Retailer penalties, slotting losses, and de-listing
- Rapid inventory turnover & clean cash conversion
- High sales per square foot / linear foot
- Strong retailer leverage for shelf positioning
The Retail Shelf Space Trap: Expansion Without Sell-Through
Securing shelf placement across 5,000 doors means little if the product sits untouched:
- Working Capital Tie-Up: Distributing to 5,000 stores requires heavy upfront inventory across multiple distribution centers. If the product moves at only 1 unit per store per week, working capital stays locked up in slow-moving stock.
- The De-Listing Cycle: Retail buyers evaluate SKUs by sales velocity per linear foot and gross margin return on investment (GMROI). If an item fails to meet the category velocity benchmark, the retailer will discount it, charge failure fees, and remove it during the next category review.
- Logistics Costs: Supporting a dispersed, low-volume store network drives up freight, warehousing, and inventory carrying costs relative to total revenue.
Store Format and Operational Simplicity Drive Unit Economics
A product’s physical and operational footprint dictates its practical output ceiling:
- Format-Capacity Alignment: A 900 sq ft convenience store cannot generate the basket size or turnover of a 40,000 sq ft supermarket. In fast food, a strip mall counter location cannot match the volume of a dual drive-thru footprint. Sales targets must reflect physical channel capacity.
- Menu and SKU Bloat: Expanding product lines introduces operational friction. Chains like Pizza Hut ($0.95M) and Subway ($0.49M) historically suffered from bloated menus, ingredient waste, and complex prep steps. Focused menus – such as Chick-fil-A’s core chicken lineup or Chipotle’s shared assembly-line ingredients – shorten order times, reduce waste, and lower labor overhead.
- Execution Consistency: High-velocity retail relies on fast, repeatable operations. Every additional option or operational step slows the line, lowers throughput during peak hours, and decreases sales per square foot.
How to Scale Physical Distribution Without Destroying Margins
Before expanding physical doors or adding retail distribution channels, verify the core unit economics:
- Verify Baseline Velocity First: Ensure the product or store format generates strong organic sales velocity in a small sample of locations before scaling distribution.
- Track Sales per Square Foot and Throughput: Prioritize revenue density over total store or shelf count. High volume in fewer locations delivers higher operating margins than low volume across a bloated footprint.
- Align Footprint with Channel Capacity: Match manufacturing volume, pack sizes, and inventory targets to the operational realities of the target store format.
- Prune Operational Complexity: Remove low-performing SKUs and operational bottlenecks. A simpler operating system produces higher labor efficiency and consistent execution.
Scale magnifies whatever operational system is in place. If unit economics and velocity are weak, expanding distribution simply spreads overhead and accelerates losses.
Frequently Asked Questions (FAQ)
Why does Chick-fil-A make so much more revenue per store than Subway?
Chick-fil-A uses standalone buildings with dual drive-thru infrastructure, large kitchen layouts, and heavy shift staffing to process high volumes of customers quickly. Subway operates smaller counter-service footprints in strip malls and transit hubs with lower customer capacity and lower average transaction sizes.
What is Average Unit Volume (AUV) and why is it important?
Average Unit Volume (AUV) measures the average annual gross sales generated by an individual store location in a franchise or retail network. It is a critical metric for evaluating the operational efficiency, customer demand, and unit-level health of a retail business.
Why is expanding store count without high sales velocity risky in FMCG?
Expanding into more retail stores requires significant capital for production, logistics, and retail slotting fees. If products do not sell through quickly at the shelf, retailers will mark down inventory and de-list the brand, leaving the manufacturer with unsellable stock and unrecovered distribution costs.
How does menu complexity impact restaurant unit economics?
A large or complex menu increases prep times, raises inventory waste, and requires more staff training. A simple, focused menu speeds up kitchen prep lines, cuts down food waste, and maximizes customer throughput during peak operating hours.


Leave a Reply