
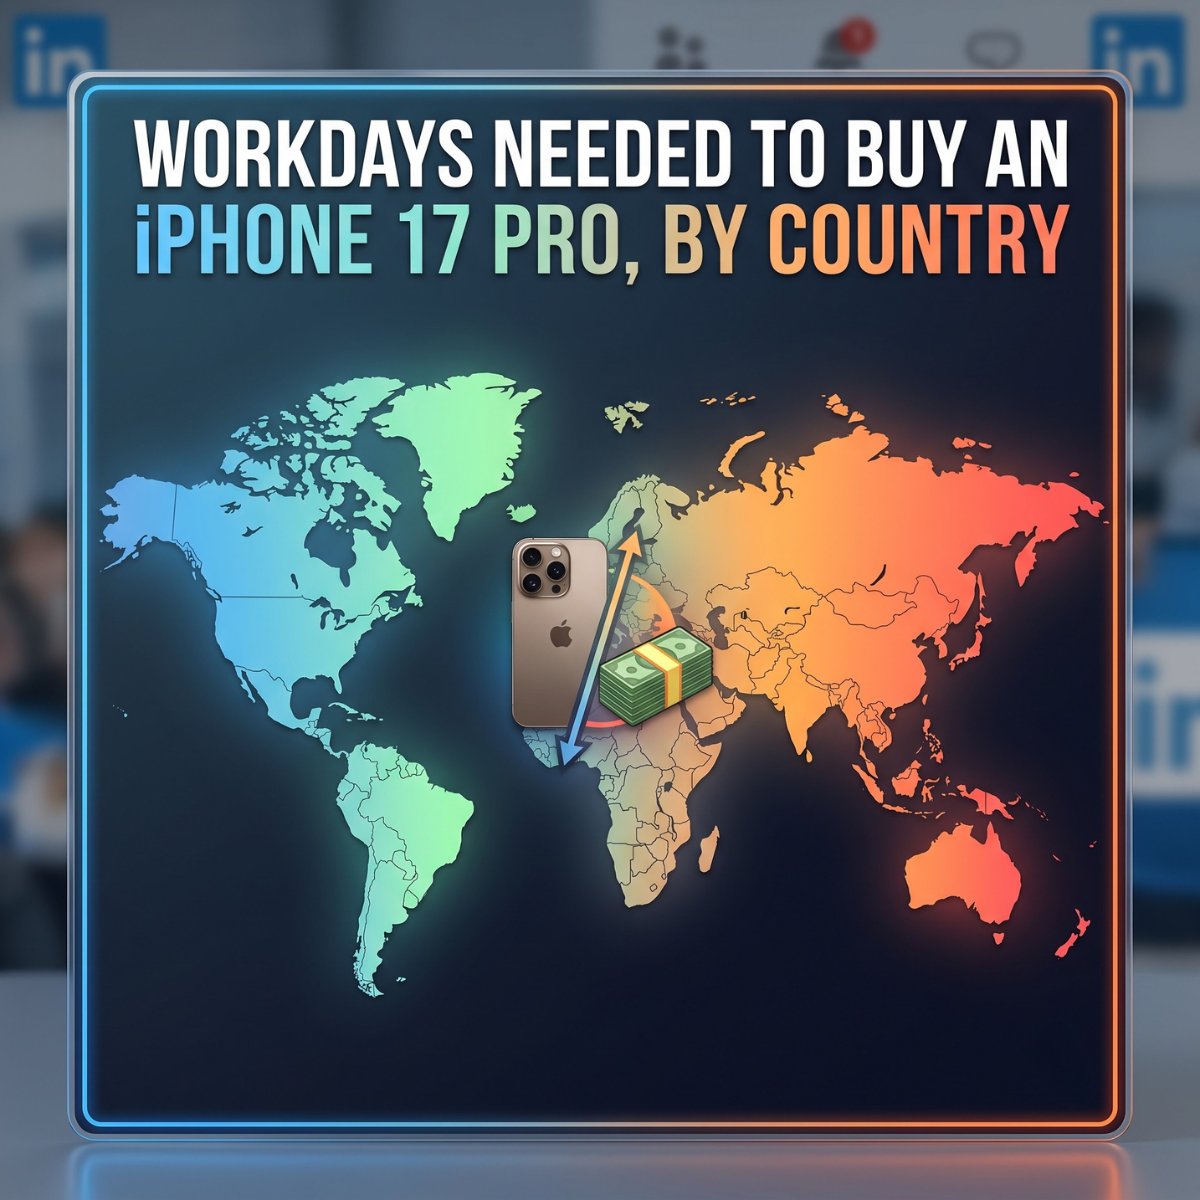
In Switzerland, it takes 3 workdays to buy an iPhone 17 Pro. In India, the chart says 160 workdays. That is 8 months of labor for a single device.
Viral charts and economic indexes love this comparison. It generates clicks. But as a tool for commercial analysis, it is an illusion. The metric measures macro-economic divides, but it completely fails to explain actual consumer behavior on the ground.

Workdays to Buy an iPhone 17 Pro
Calculated using eight-hour workdays, local average wages, and local iPhone prices (256GB).
Average of countries shown: 26
| Country | Region | Workdays |
|---|---|---|
| Luxembourg | Europe | 3 |
| Switzerland | Europe | 3 |
| U.S. | N. America | 4 |
| Belgium | Europe | 4 |
| Denmark | Europe | 4 |
| Netherlands | Europe | 4 |
| Norway | Europe | 4 |
| Australia | Oceania | 5 |
| Austria | Europe | 5 |
| Finland | Europe | 5 |
| Ireland | Europe | 5 |
| Germany | Europe | 5 |
| Canada | N. America | 5 |
| France | Europe | 6 |
| Sweden | Europe | 6 |
| UK | Europe | 7 |
| New Zealand | Oceania | 7 |
| Singapore | Asia | 8 |
| Italy | Europe | 8 |
| UAE | Middle East | 8 |
| Spain | Europe | 9 |
| Czechia | Europe | 12 |
| Poland | Europe | 17 |
| Portugal | Europe | 24 |
| Hungary | Europe | 27 |
| Chile | S. America | 32 |
| Malaysia | Asia | 45 |
| Thailand | Asia | 61 |
| Brazil | S. America | 77 |
| Türkiye | Asia | 89 |
| Vietnam | Asia | 99 |
| Philippines | Asia | 101 |
| India | Asia | 160 |
Source: Tenscope / Visual Capitalist.
Note: Despite partly assembling in India, high import duties and low average wages keep iPhones expensive there.
Source: Visual capitalist
If it takes 160 days of wages to buy a phone, nobody should have one. Yet, Apple continues to post record revenues in emerging markets. To understand consumer purchasing power and retail trends, we have to look at the mechanics of how people actually spend money, not just what a broad index tells us.
Here is what is actually happening in the market.
The Reality of Smartphone Financing and Micro-Loans
Nobody drops 160 days of cash on a retail counter. The upfront purchase of premium electronics is becoming rare globally.
Over 50% of smartphone sales in emerging markets are financed. Consumers use 12- to 24-month micro-loans, Buy Now Pay Later (BNPL) services, and Equated Monthly Installments (EMIs). The credit infrastructure in these regions is highly optimized to move electronics.
In Western Europe and the US, the mechanism is different but the result is the same. Carrier deals, trade-in credits, and 36-month installment plans mask the true price of the device.
The shopper does not look at the €1,300 price tag. They look at the €35 monthly commitment. This shifts the smartphone from a major capital expense to a fixed monthly utility bill. When you analyze a market based on the upfront cash price, your data is already disconnected from reality.
The Refurbished Market and Older Generations
Another assumption is that everyone is buying the latest Pro model. This is false.
In developed markets like the US or the UK, Pro models make up around 60% of the sales mix. The high-income consumer base upgrades frequently.
In emerging markets, the volume does not come from the iPhone 17 Pro. The volume comes from older generations—the iPhone 13, 14, or 15—and from the secondary refurbished market.
- Apple holds over 60% of the organized refurbished smartphone market globally.
- Older models are discounted heavily but still carry the premium brand status.
- Consumers are buying into the iOS ecosystem at a lower entry point, often pairing it with financing.
When a viral chart compares the newest Pro model against an emerging market wage, it compares a product the average consumer does not buy against an income they do not make.
Flaws in Average Wage Metrics for Retail Analysis
Using the “average wage” to calculate purchasing power is a fundamental statistical error for premium brands.
Take India as an example. The national average wage includes millions of agricultural workers and rural laborers. These demographics exist entirely outside Apple’s target market. They pull the national average down, skewing the data.
The actual buyer of a premium smartphone in these markets is part of the urban middle class. They work in tech, finance, or corporate sectors. Their income is significantly higher than the national average. For the actual target buyer, the real cost of a flagship device is closer to 10 to 15 workdays, not 160.
Building commercial strategy based on national averages leads to bad decisions. You have to segment the data to match the actual addressable market.
The Ripple Effect on the FMCG Market and Supermarket Retail
Why does this matter for retail, supermarkets, and Fast-Moving Consumer Goods (FMCG)? Because consumer credit has a direct impact on the daily grocery budget.
In consulting work with commercial teams, we see the real consequence of this specific consumer behavior. A fixed monthly tech payment drains liquid cash. The grocery budget is variable, which makes it vulnerable.
When a shopper commits €35 every month to pay off a smartphone, that money leaves their daily spending pool. They hold a premium device, but they have to balance their budget in the supermarket aisles. This creates a bipolar consumer profile.
The Shift to Private Label Goods
To maintain their tech and lifestyle subscriptions, consumers trade down in daily essentials. They switch from premium brand staples to entry-level private label goods. A consumer might hold an iPhone 17 but buy the cheapest store-brand pasta and detergent.
The Decline of Impulse Buying
When cash is locked up in monthly installments, the impulse category takes a hit.
- Shoppers stick strictly to their grocery lists.
- They skip high-margin impulse snacks at the checkout.
- They reduce spending on premium beverages and non-essential items.
The Rise of Hard Discounters
We see a direct shift in foot traffic toward hard discounters. Shoppers who previously bought groceries at mid-tier supermarkets move their weekly basket to discount chains to offset their fixed credit commitments.
Lessons for Commercial Strategy and Brand Leaders
If you are a commercial director or a brand manager, you must adapt to this reality. The data points to two clear rules for the current retail landscape:
- Demographics lie. Visual indicators of wealth are no longer accurate. The consumer holding a flagship smartphone is often the same person buying the cheapest available toilet paper. You cannot assume that premium tech ownership translates to a willingness to pay premium prices in FMCG categories.
- Credit eats basket size. Consumer financing for tech, cars, and lifestyle locks up monthly cash. When the wallet shrinks, FMCG brands without genuine, defensible brand equity are the first to lose volume. If your product is easily substituted, the consumer will drop it to pay for their phone installment.
To survive this shift, FMCG brands must justify their price premium with hard facts and clear utility, not just marketing gloss. Otherwise, private labels will continue to absorb their market share.
Are you seeing tech installments and fixed monthly costs shrink basket sizes in your specific categories? Look closely at the data.
FAQ: Consumer Purchasing Power and the iPhone Index
What is the iPhone Index?
The iPhone Index is an unofficial economic indicator that calculates how many days an average worker in a specific country must work to afford the latest baseline or Pro iPhone model. It is used to compare global purchasing power.
Why is the average wage a bad metric for premium retail analysis?
Average national wages include populations outside a premium brand’s target market, such as rural or minimum-wage workers. This skews the data downward. Premium brands target higher-income urban segments, making national averages irrelevant for calculating actual target consumer purchasing power.
How does smartphone financing impact FMCG sales?
When consumers lock themselves into monthly micro-loans or BNPL contracts for electronics, their liquid cash decreases. To compensate, they cut their variable budgets, leading to smaller grocery basket sizes, reduced impulse buying, and a shift toward cheaper FMCG alternatives.
What is the “bipolar consumer” trend in retail?
This is a trend where a single consumer exhibits both premium and extreme discount shopping behaviors. For example, they finance expensive luxury or tech items (like a flagship smartphone) but trade down to the cheapest private label goods in the supermarket to balance their overall budget.
Why are private label goods growing in market share?
Private label goods (store brands) are growing because consumers are reallocating their daily spending. Fixed costs like tech installments, subscriptions, and inflation force shoppers to abandon mid-tier FMCG brands in favor of cheaper, functional store brands.
Related posts:
 The €500M Olive Oil War: Why Spain and Italy Are Fighting for Bertolli
 IMD World Competitiveness Ranking 2026: Global Sourcing Shifts and Commercial Reality
 Self-Checkout Shrinkage European Retailers Study 2026
 Battle for Portugal: Mercadona vs Market
 Global IQ Ranking by Country 2026: Top 50 Data Audit
 EU Small Parcel Tax: Why the New Custom Rules Won’t Stop Shein & Temu
Leave a Reply