
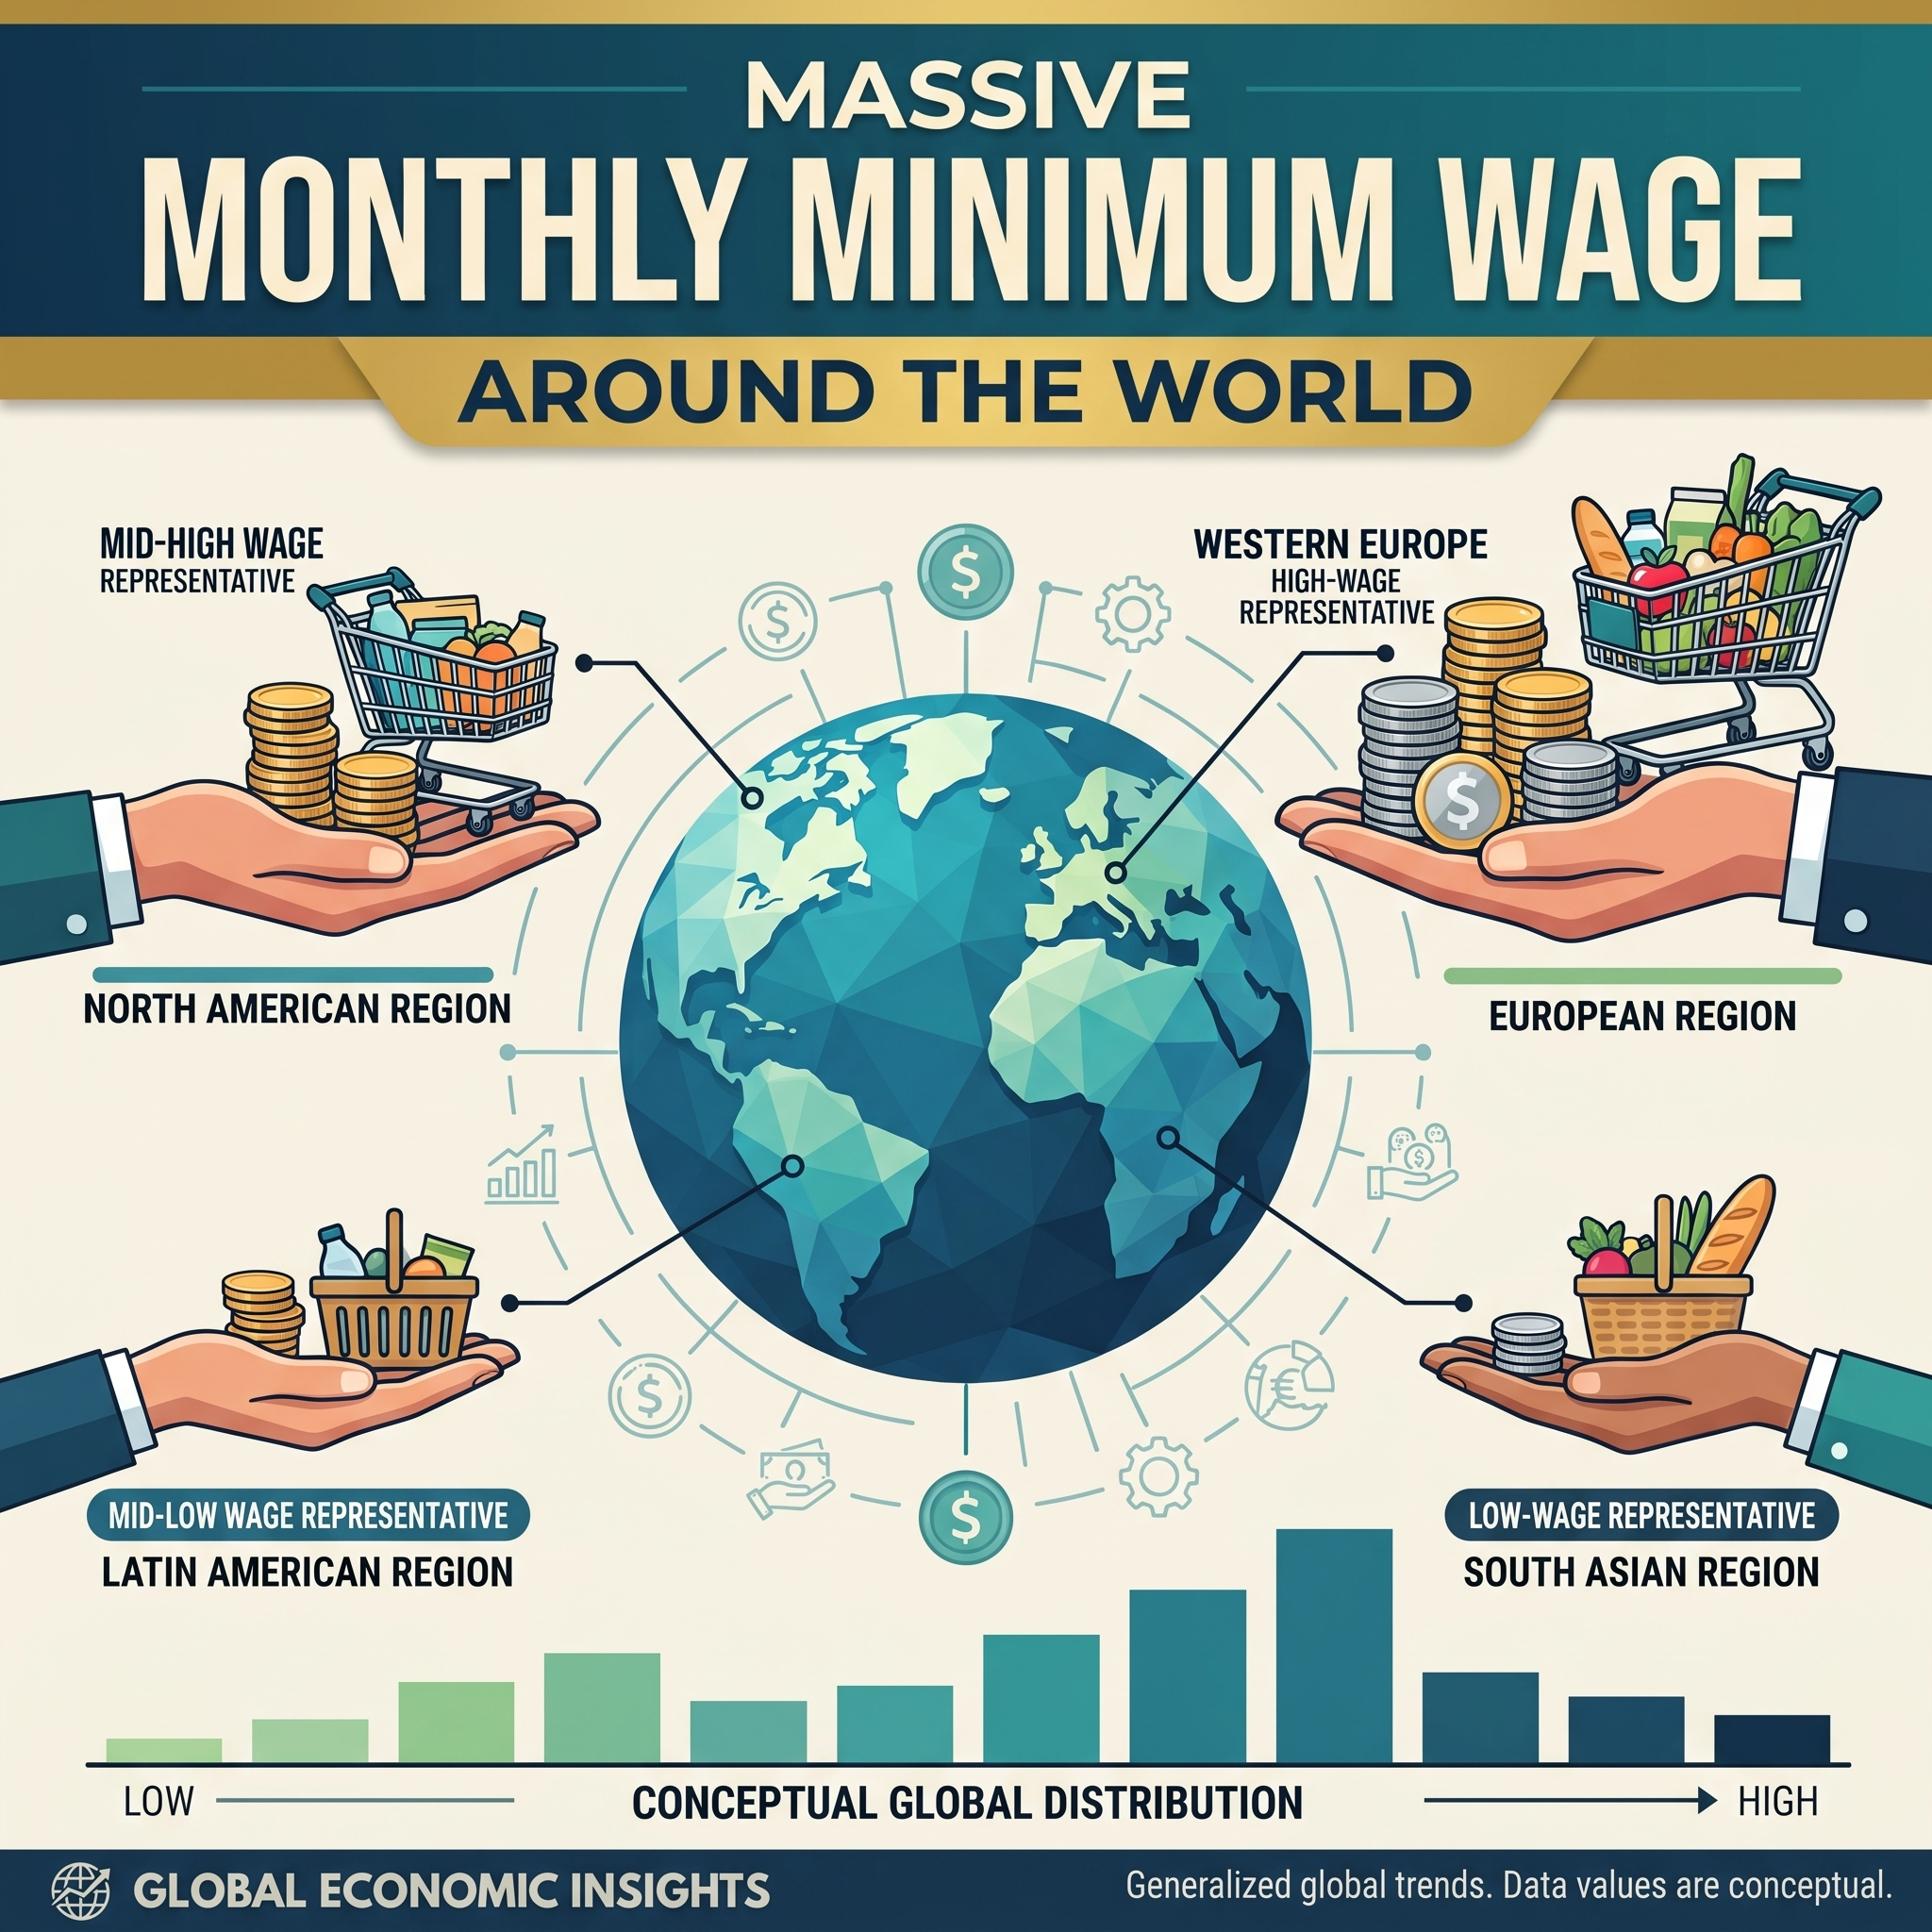
A Global minimum wage comparison reveals that a worker on minimum wage in Poland currently has more local purchasing power – around $2,100 PPP per month – than a minimum wage worker in Japan ($1,800 PPP) or Portugal ($1,700 PPP).
Yet, boardroom executives in retail, food and beverage, and FMCG still plan international rollouts using nominal Gross Domestic Product (GDP). Even worse, they look at headline statutory wage charts without checking how far that money actually goes in a local discount store.

Monthly Minimum Wage by Region (PPP-Adjusted)
Europe
| Country | Monthly Wage (PPP) |
|---|---|
| Switzerland Highest | $3,800 |
| Germany | $2,900 |
| United Kingdom | $2,900 |
| Iceland | $2,700 |
| France | $2,500 |
| Ireland | $2,400 |
| Spain | $2,200 |
| Poland | $2,100 |
| Romania | $1,800 |
| Portugal | $1,700 |
North America
| Country | Monthly Wage (PPP) | Notes |
|---|---|---|
| Canada | $2,300 | Median of provincial rates |
| United States | $1,300 | Based on $7.25/hr federal minimum vs state average |
Asia & Oceania
| Country | Monthly Wage (PPP) |
|---|---|
| Australia | $2,800 |
| New Zealand | $2,700 |
| South Korea | $2,400 |
| Japan | $1,800 |
| Indonesia | $993 |
| Russia | $662 |
| China | $544 |
| Philippines | $400 |
| India | $233 |
Latin America & Caribbean
| Country | Monthly Wage (PPP) |
|---|---|
| Chile | $1,100 |
| Argentina | $568 |
| Brazil | $559 |
| Peru | $526 |
| Haiti | $167 |
Africa
| Country | Monthly Wage (PPP) |
|---|---|
| South Africa | $620 |
| Kenya | $361 |
| Angola | $225 |
| Madagascar | $210 |
| Gambia Lowest | $67 |
Values represent 2021 PPP dollars adjusted for local purchasing power as of 2024.
Source: Visual Capitalist.
Both habits burn cash.
Nominal GDP tells you how big an economy looks when converted to US dollars. It tells you nothing about the person stacking shelves, driving a delivery van, or working a cash register. That worker’s real purchasing power determines your product turnover on a Tuesday night.
| Country | Nominal Minimum Wage (Approx. Monthly USD) | PPP-Adjusted Wage (Monthly Int. $) |
|---|---|---|
| Poland | ~$1,100 | ~$2,100 |
| Japan | ~$1,150 | ~$1,800 |
| Portugal | ~$1,000 | ~$1,700 |
| United States | ~$1,250 (Federal) | ~$1,300 (Statutory) |
Why Nominal GDP Misleads FMCG and Retail Expansion Strategy
Nominal GDP numbers create blind spots. When corporate planners look only at aggregate output, they assume that a higher nominal GDP per capita automatically means a better retail market for volume goods.
This assumption fails for three main reasons:
- Top-heavy income distribution: High nominal GDP often hides extreme income concentration. If top earners take 40% of the national income, the average number looks healthy, but the median household has little disposable cash after paying rent and utilities.
- The baseline food and grocery floor: Mass-market FMCG runs on volume, not luxury margins. Minimum wage by Purchasing Power Parity (PPP) shows the absolute floor of mass consumption. It defines who can afford private-label groceries, branded shampoo, dairy products, and packaged snacks every week.
- The Central European market shift: Retailers who skipped Poland, Romania, or the Czech Republic a decade ago because their nominal wages looked “too low” missed the largest hard-discount retail boom in Europe. Chains like Biedronka and Dino Polska grew rapidly because local purchasing power for everyday consumer goods expanded much faster than Western European nominal figures suggested.
Four Operational Traps in Global Market Entry
Evaluating a target market requires looking past simple government wage declarations. In real-world retail operations, theoretical data runs into practical operational bottlenecks.
| Headquarter Planning | |
|---|---|
| Operational Trap | Ground Reality / Impact |
| Trap 1: Statutory vs OPEX | High Social Taxes & Real Market Clearing Wages |
| Trap 2: CapEx vs PPP Squeeze | Global Equipment Costs vs Low Nominal Baskets |
| Trap 3: Informal Workforces | Hidden Income & Urban Clustered Wealth |
| Trap 4: FX Devaluation | Currency Shifts Eating Imported COGS |
1. Statutory Rates vs Fully Loaded Labor Cost in Store OPEX
A legal minimum wage is rarely your actual store-level labor cost.
- Market-clearing wages: In the United States, the federal minimum wage remains stuck at $7.25 per hour (about $1,300 PPP monthly). However, no national grocery chain or quick-service restaurant can hire reliable store staff at that rate. Market rates in most metro areas start between $15.00 and $18.00 per hour.
- Mandatory payroll taxes: In countries like France, Poland, or Brazil, the statutory gross wage is only part of the equation. Employers must pay mandatory social security, pension funds, health insurance, and accident funds. These payroll taxes add 20% to 45% on top of the base salary.
- Shift and holiday premiums: Mandatory double-pay on Sundays or night-shift surcharges in European markets can increase store labor operational expenditures (OPEX) by another 10% to 15% across a 24/7 supply chain.
2. The CapEx vs Local PPP Margin Squeeze
This is the most common reason foreign retailers fail to turn a profit abroad:
- Equipment costs are global (Nominal USD/EUR): Commercial refrigeration racks (Carrier, Linde), POS systems, automated self-checkouts, logistics software, and store racking systems are imported at hard-currency rates. A square meter of store fit-out costs roughly the same in Lisbon, Warsaw, or Tokyo.
- Customer spending is local (PPP): Your shoppers pay in local currency based on local purchasing power.
- The payback mismatch: If your fit-out costs $1.5 million per store, but the average basket size in nominal terms is only $14 (even if that $14 buys a full basket in local PPP terms), you need double the customer footfall just to amortize the store buildout within five years.
3. Informal Economies and Regional Purchasing Power Distortions
National averages hide regional realities. In emerging markets, official statistics often misrepresent actual consumer liquidity:
- Informal cash income: In countries like Brazil ($559 PPP official minimum wage), India ($233 PPP), Mexico, or Turkey, millions of workers earn undocumented cash in trade, construction, agriculture, and informal services. They have more real purchasing capacity than tax agency records show.
- Urban clustering: A country’s national average might look unviable, but tier-1 cities tell a different story. São Paulo, Istanbul, Jakarta, and Mumbai have urban middle-class populations larger than entire European nations. These urban hubs possess high disposable income, concentrated logistics, and high-density retail traffic.
4. Currency Devaluation and Import Margin Erosion
When local wages look attractive on a PPP basis, currency swings can still destroy your profit margins if your inventory depends on foreign supply chains.
- Imported COGS: If you sell imported personal care products, coffee, electronics, or foreign branded foods, you pay for your Cost of Goods Sold (COGS) in USD or EUR.
- The pricing ceiling: If the local currency drops 20% against the dollar, you cannot simply raise shelf prices by 20%. The local minimum-wage shopper’s salary has not increased, meaning aggressive price hikes will collapse unit sales volume overnight.
Retail Expansion Framework: A Practical Model for Global Rollout
To conduct an effective international market assessment and evaluate a new market accurately, run every expansion plan through a four-layer verification model before approving capital expenditure.
| Layer | Metric | What It Measures | Strategic Decision |
|---|---|---|---|
| Layer 1 | Nominal GDP & FX Volatility | Macroeconomic scale and currency stability. | Tests if store fit-out (CapEx) can be amortized and if profits can be repatriated. |
| Layer 2 | Fully Loaded Hourly Labor Cost | Gross wages plus employer social taxes and required benefits. | Establishes the real OPEX baseline for store operations, cashiers, and logistics staff. |
| Layer 3 | Minimum & Median Wage by PPP | True purchasing power of working-class and middle-class households. | Sets the pricing strategy for private-label products, food staples, and FMCG volume lines. |
| Layer 4 | Metro-Level Disposable Cash | Income density in target cities, including informal market estimates. | Directs real estate site selection, store formats, and distribution center placement. |
The Four-Step Market Assessment Workflow
| Execution Phase | Strategic Action |
|---|---|
| Step 1 CapEx Payback Check | Test nominal basket size against imported store fit-out costs. |
| Step 2 Real Payroll Audit | Calculate fully loaded labor rates (base pay + 30-45% taxes). |
| Step 3 FMCG Floor Sizing | Map local PPP minimum wage to unit pricing of key staples. |
| Step 4 Density Mapping | Ignore national averages; focus on top 3-5 urban clusters. |
- Step 1: Run a Hard CapEx Payback Stress Test. Calculate your total store setup cost in nominal USD or EUR. Calculate how many individual transactions are needed to cover the depreciation, based on local nominal basket sizes rather than home-market projections.
- Step 2: Audit True Payroll Costs. Ignore government headline wage minimums. Talk to local staffing agencies to get the true market-clearing rate and add all statutory employer social contributions.
- Step 3: Size the Local FMCG Volume Floor. Look at what a minimum-wage worker earns under local PPP. If a standard grocery basket of milk, bread, eggs, and hygiene products takes more than 15% of their daily wage, pivot the product mix toward discount private labels.
- Step 4: Target Dense City Hubs First. Do not launch nationwide distribution based on country-level averages. Build supply chain density in urban centers where actual disposable cash flow is concentrated.
Frequently Asked Questions
What is the difference between Nominal Minimum Wage and PPP Minimum Wage?
Why does Poland have a higher PPP minimum wage than Japan?
How does PPP affect pricing strategy for foreign retail brands?
Why should retailers avoid relying only on national GDP per capita?
Related posts:
 The €500M Olive Oil War: Why Spain and Italy Are Fighting for Bertolli
 Spain Grocery Market Share 2026: Why Giants Flatline
 Seasonal Retail Inventory Management: 85/15 Buffer Model
 Spain Grocery retail market share July 2026
 National Brands vs Private Labels in Europe: The Reality Behind the Data
 Emerging Megacities: FMCG Retail Trends and Consumer Shifts by 2050
Leave a Reply