
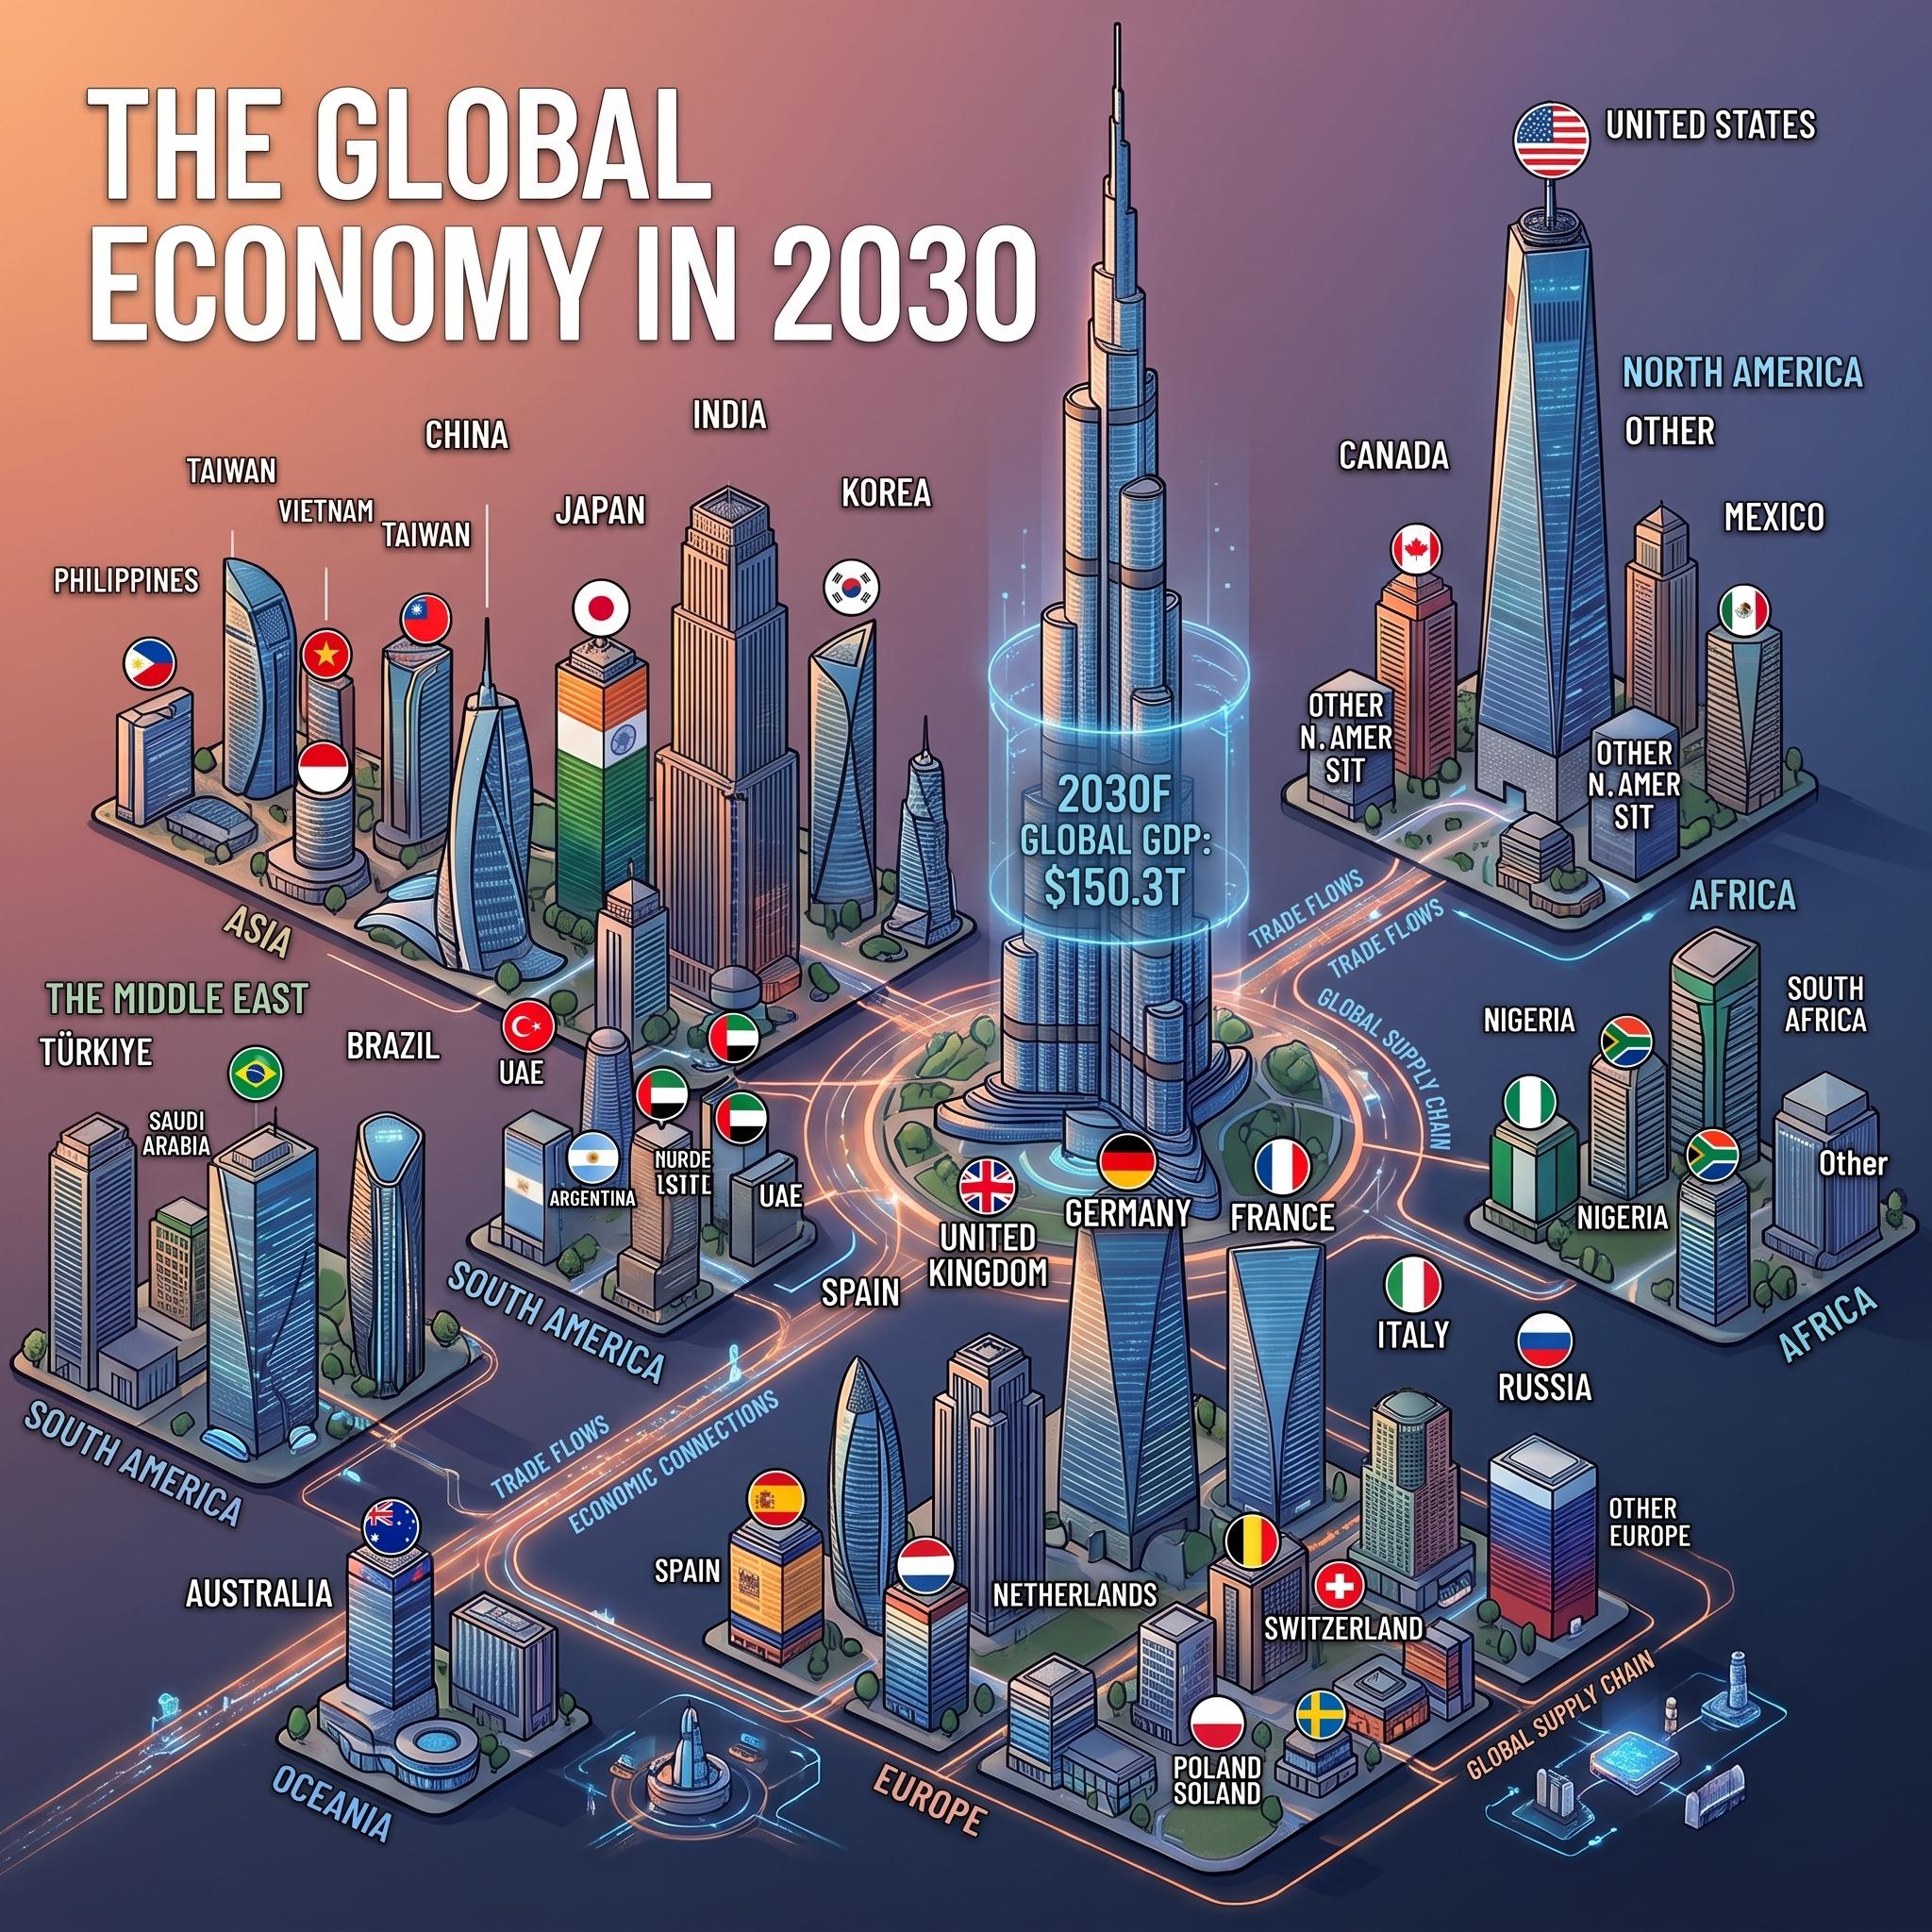
The International Monetary Fund (IMF) long-term outlook projects the global economy will reach $150.3 trillion by 2030. Visualizations of this data show a striking comparison: India and Germany are both projected to reach an identical nominal GDP of $6.2 trillion.

| Region / Country | 2030 Nominal GDP Forecast |
|---|---|
| Asia | $49T |
| China | $26T |
| India | $6.2T |
| Japan | $5T |
| South Korea | $2.3T |
| Indonesia | $2.1T |
| Taiwan | $1.2T |
| Singapore | $788B |
| Philippines | $716B |
| Bangladesh | $677B |
| Malaysia | $672B |
| Vietnam | $668B |
| Thailand | $648B |
| Hong Kong | $537B |
| Kazakhstan | $469B |
| Other | $1T |
| North America | $44.3T |
| United States | $37.7T |
| Canada | $3T |
| Mexico | $2.5T |
| Other | $1T |
| Europe | $37T |
| Germany | $6.2T |
| United Kingdom | $5.1T |
| France | $4T |
| Italy | $3T |
| Russia | $2.6T |
| Spain | $2.5T |
| Netherlands | $1.7T |
| Poland | $1.4T |
| Switzerland | $1.3T |
| Sweden | $910B |
| Ireland | $894B |
| Belgium | $864B |
| Austria | $707B |
| Romania | $614B |
| Norway | $612B |
| Denmark | $589B |
| Czechia | $507B |
| Portugal | $445B |
| Finland | $389B |
| Greece | $357B |
| Hungary | $330B |
| Other 22 Countries | $1.9T |
| Middle East | $6.7T |
| Türkiye | $1.9T |
| Saudi Arabia | $1.6T |
| Israel | $876B |
| UAE | $770B |
| Iran | $350B |
| Iraq | $340B |
| Other | $762B |
| South America | $6T |
| Brazil | $3.2T |
| Argentina | $833B |
| Colombia | $632B |
| Chile | $497B |
| Peru | $437B |
| Other | $419B |
| Africa | $4.5T |
| Egypt | $611B |
| South Africa | $555B |
| Nigeria | $465B |
| Algeria | $325B |
| Other 49 Countries | $2.6T |
| Oceania | $2.9T |
| Australia | $2.5T |
| New Zealand | $327B |
| 2030F Global GDP | $150.3T |
Source: Visual Capitalist
When executives see this chart, many make a fast and dangerous assumption: “Europe is stagnant. Move all commercial budgets, marketing spend, and product launches to Asia.”
That reaction is a strategic trap.
Top-line macro GDP looks impressive in board presentations, but national GDP does not buy consumer products. Individual shoppers with disposable income do. Comparing two countries with identical total GDP without analyzing population size, distribution infrastructure, and basket margins leads to expensive business mistakes.
India vs Germany GDP: Wallets vs Headcount
The most critical mistake in commercial planning is confusing total economic output with individual purchasing power.
| GERMANY | INDIA |
|---|---|
| $6.2T Total GDP | $6.2T Total GDP |
| 84M People | 1.45B People |
| [$74,000 / Person] | [$4,300 / Person] |
| High Discretionary Cash | Basic Survival Spend |
Discretionary Spending and Addressable Market Sizing
- Germany ($6.2 Trillion / 84 Million People): GDP per capita is approximately $74,000. The average consumer has substantial discretionary income left over after covering housing, food, and utilities. They regularly buy premium personal care, bio-foods, packaged convenience goods, and branded household items.
- India ($6.2 Trillion / 1.45 Billion People): GDP per capita sits around $4,300. While the country has an expanding upper-middle class, the vast majority of consumer income is spent on basic necessities like staple grains, basic shelter, and transport.
The average German consumer commands over 17 times the nominal spending power of the average Indian consumer.
For a consumer goods company, India’s true addressable market for standard-priced international goods is not 1.45 billion people. It is a concentrated group of roughly 80 to 120 million urban consumers. In Germany, almost the entire 84 million population belongs to the addressable market.
FMCG Distribution Economics: Modern Trade vs General Trade
A company cannot look at market size without calculating the physical cost to serve retail stores. Understanding the nuances of Modern Trade General Trade, and how a product moves from the factory to the checkout shelf, determines whether a brand makes a profit or burns cash.
| EUROPEAN DISTRIBUTION (MODERN TRADE) |
|---|
|
Factory
➔
Central Warehouse
➔
Supermarket
➔
Consumer
(Single Delivery Point / Full Pallets)
|
| EMERGING MARKET DISTRIBUTION (GENERAL TRADE) |
|
Factory
➔
C&F Agent
➔
Distributor
➔
Wholesaler
➔
Kirana
(Multiple Middlemen Markups / Small Drops)
|
The High Cost to Serve Fragmented Retail Networks
- Modern Trade in Europe: In mature European markets, organized supermarket chains (such as Edeka, Rewe, Carrefour, Tesco, Aldi, and Lidl) control 80% to 90% of grocery retail. A brand negotiates a single annual contract with a central buying committee and delivers full truckloads directly to automated regional distribution centers.
- General Trade in Emerging Markets: In India and similar developing markets, 75% to 80% of retail volume moves through “General Trade”—millions of tiny, independent mom-and-pop kiosks (kirana stores).
- Layered Intermediaries: Servicing millions of unorganized kiosks requires a complex supply chain: carrying and forwarding (C&F) agents, city distributors, local stockists, and sub-wholesalers. Every layer takes a commercial margin cut (often 3% to 8% per layer).
- Logistics Overhead: Delivering small cartons down congested city streets or to rural villages requires massive van fleets, manual cash collection, higher stock shrinkage, and long credit cycles. These operational friction points eat away gross margins before the product reaches the end consumer.
Retail Unit Economics: Single-Serve Sachets vs High-Margin Baskets
High sales volume does not equal high bank balances. In fast-moving consumer goods (FMCG), unit economics dictate actual cash generation.
Tonnage Volume vs Absolute Cash Contribution
To penetrate price-sensitive emerging markets, global brands rely heavily on Low Unit Price (LUP) packs—such as single-use shampoo sachets, mini soap bars, and small biscuit packs priced at ₹5 or ₹10 ($0.06 to $0.12).
- Packaging Cost Inefficiency: A single-dose sachet requires significantly more plastic film and packaging material per milliliter of product than a 500ml family bottle. You spend more money wrapping the product than making the formula.
- Margin Dollar Generation: If you sell a sachet for $0.10 with a 20% operating margin, you make $0.02 in cash profit. To make $2.00 in profit, you must produce, pack, transport, and sell 100 individual sachets.
- The European Basket Reality: In a European supermarket, a consumer buys a €4.50 premium shampoo bottle or an €8.00 skin cream. A 15% margin on that single unit generates €0.65 to €1.20 in hard cash.
High tonnage and billion-unit sales numbers look great in annual corporate reports, but single-serve unit margins rarely cover large central corporate overheads.
Comparative Analysis: Germany vs India Retail Landscape
| Strategic Dimension | Germany (Mature European Hub) |
India (High-Growth Asian Giant) |
Commercial Implication |
|---|---|---|---|
| Projected 2030 GDP | $6.2 Trillion | $6.2 Trillion | Equal macro size; completely different buying behavior. |
| Population Base | ~84 Million | ~1.45 Billion | Germany offers concentrated wealth; India offers massive scale. |
| GDP Per Capita | ~$74,000 | ~$4,300 | 17x difference in nominal discretionary spending. |
| Primary Retail Channel | Modern Trade (80–90%) | General Trade / Kiranas (75–80%) | Europe has lower distribution friction; Asia has high distributor costs. |
| Pack Architecture | Large packs, multi-buys, premium | Low Unit Price (LUP), single-use sachets | Europe delivers cash per unit; Asia delivers unit volume. |
| Currency Risk (FX) | Stable (EUR) | Emerging FX volatility (INR) | Local growth in Asia can be reduced when converted back to EUR/USD. |
Global Market Expansion Strategy: Protecting the European Cash Engine
Abandoning or defunding European operations to chase top-line emerging market GDP numbers is a flawed commercial strategy. Europe is the cash engine that generates the reliable profits needed to fund international expansion, factory automation, and research and development.
|
EUROPEAN CORE
|
FUNDS ➔ |
EMERGING MARKET BETS
|
A Realistic Two-Track Commercial Framework
- Defend and Optimize Europe:
- Protect category margins with disciplined pricing architecture.
- Defend shelf space against aggressive private-label retailer brands by emphasizing product efficacy and packaging convenience.
- Extract maximum free cash flow through supply chain automation and direct-to-warehouse logistics.
- Execute Targeted Expansion in Emerging Markets:
- Avoid trying to distribute products to every rural village across a sub-continent.
- Focus capital on high-density Tier 1 and Tier 2 urban hubs (such as Mumbai, Delhi, and Bengaluru).
- Prioritize modern grocery chains and fast-growing Quick-Commerce platforms (like Blinkit, Zepto, and Instamart) where high-income consumers shop and delivery friction is lower.
- Tailor product portfolios specifically for the affluent urban segment rather than racing to the bottom on price in unorganized trade.
Frequently Asked Questions on Global GDP and FMCG Strategy
Why is nominal country GDP misleading for commercial retail strategy?
Should consumer brands stop investing in emerging markets?
What is the primary hidden expense in emerging market distribution?
How does packaging size impact absolute profit margins?
How does currency volatility affect emerging market revenue?
Related posts:
 National Brands vs Private Labels in Europe: The Reality Behind the Data
 Seasonal Retail Inventory Management: 85/15 Buffer Model
 Spain Grocery Market Share 2026: Why Giants Flatline
 Aldi vs Tesco Sainsbury Loyalty Schemes: 2026 Analysis
 Emerging Megacities: FMCG Retail Trends and Consumer Shifts by 2050
 How Mercadona outperforms Carrefour through EDLP models and KVI consumer perception
Leave a Reply