
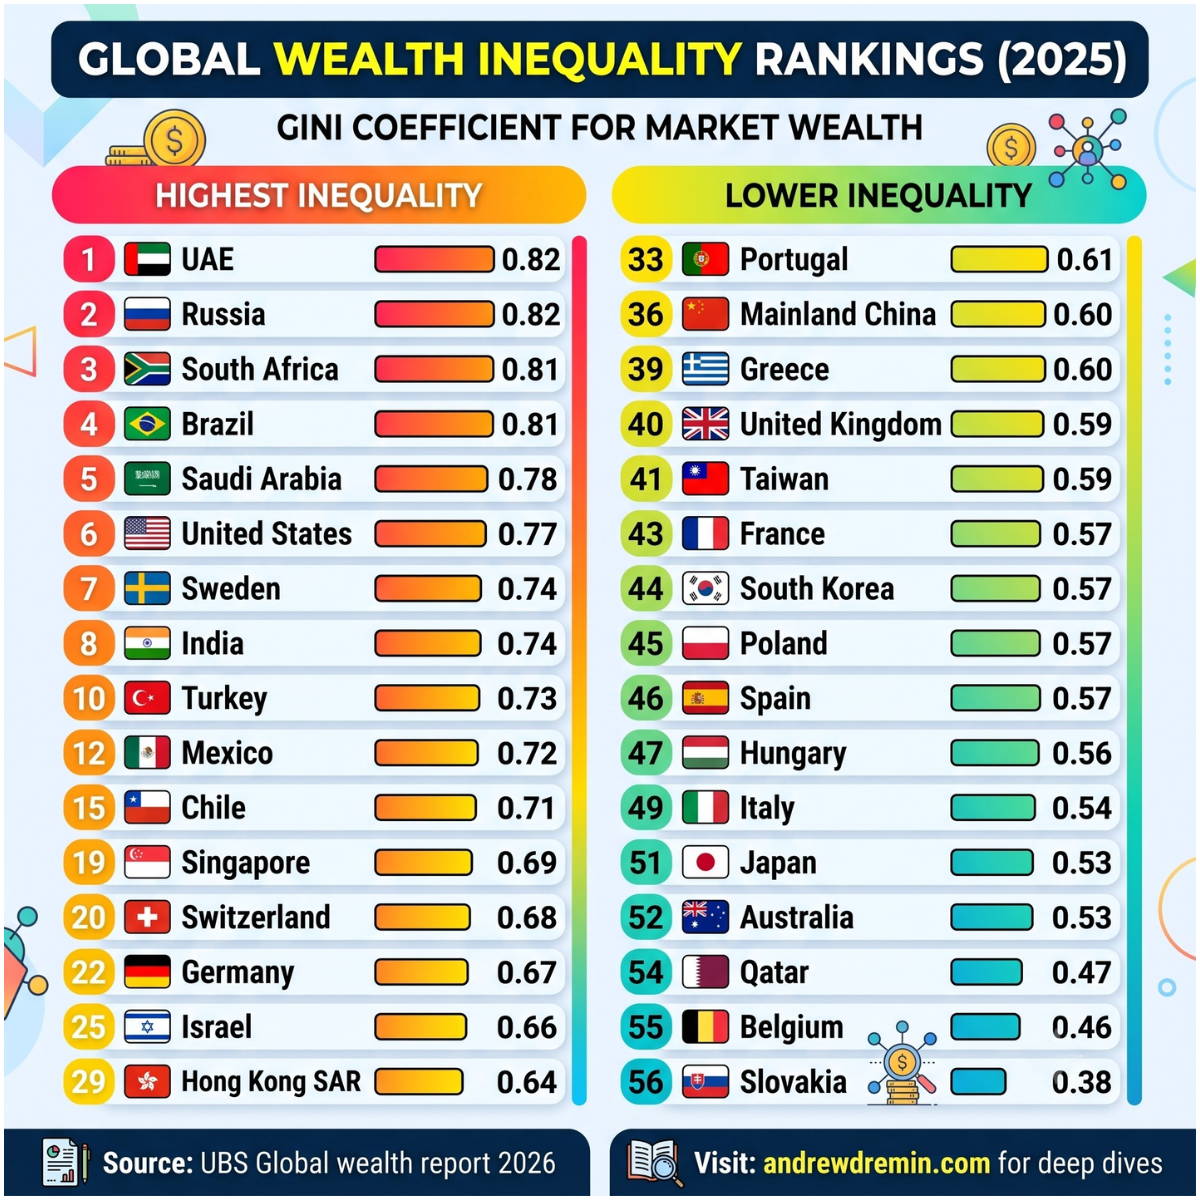
0.77. That is the wealth Gini coefficient of the United States according to recent global data. Most retail managers look at US GDP per capita, see a high number, and assume it is an automatic goldmine. They are wrong. High economic averages hide a brutal structural reality for consumer brands.
To understand the market, you must look at the data properly. The Gini coefficient measures wealth inequality on a scale from 0 to 1. Zero means everyone has the exact same amount of money. One means a single person owns everything. When a market hits 0.77 like the US, or 0.82 like the United Arab Emirates and Russia, it means the “average consumer” does not exist in reality.
Even traditional European markets now show high inequality levels: Sweden is at 0.74 and Germany is at 0.67. If you plan your business expansion using only top-line GDP figures, you are reading a financial fairy tale.
| Rank | Country | Gini Coefficient |
|---|---|---|
| 1 | UAE | 0.82 |
| 2 | Russia | 0.82 |
| 3 | South Africa | 0.81 |
| 4 | Brazil | 0.81 |
| 5 | Saudi Arabia | 0.78 |
| 6 | United States | 0.77 |
| 7 | Sweden | 0.74 |
| 8 | India | 0.74 |
| 10 | Turkey | 0.73 |
| 12 | Mexico | 0.72 |
| 15 | Chile | 0.71 |
| 19 | Singapore | 0.69 |
| 20 | Switzerland | 0.68 |
| 22 | Germany | 0.67 |
| 25 | Israel | 0.66 |
| 29 | Hong Kong SAR | 0.64 |
| 33 | Portugal | 0.61 |
| 36 | Mainland China | 0.60 |
| 39 | Greece | 0.60 |
| 40 | United Kingdom | 0.59 |
| 41 | Taiwan | 0.59 |
| 43 | France | 0.57 |
| 44 | South Korea | 0.57 |
| 45 | Poland | 0.57 |
| 46 | Spain | 0.57 |
| 47 | Hungary | 0.56 |
| 49 | Italy | 0.54 |
| 51 | Japan | 0.53 |
| 52 | Australia | 0.53 |
| 54 | Qatar | 0.47 |
| 55 | Belgium | 0.46 |
| 56 | Slovakia | 0.38 |
The Flaw of Averages
If your neighbor eats two steaks and you eat zero, on average you both had a steak. This is standard mathematics, but it is terrible retail strategy. GDP tells you the total size of the economy. Inequality tells you who actually has the cash to spend in your stores.
Why do smart executives make this mistake? Because aggregated corporate spreadsheets are comfortable. When a board of directors looks at a global expansion map, they like large, clean numbers. They look at high Purchasing Power Parity (PPP) and assume every household has thousands of dollars of disposable income every month. They forget that a small group of ultra-wealthy individuals pulls the mathematical average straight up. The middle of the distribution curve is completely empty.
The Reality Check: You cannot sell products to a mathematical average. You can only sell products to real people with real wallets.
Case Study: The Disappearing Middle Class
I have an experience evaluating the expansion plan for a mid-premium grocery brand. The company wanted to enter a specific high-GDP region. On paper, the region looked perfect. The average household income was well above the national threshold. The marketing team was already looking for premium real estate to sign long-term commercial leases.
I looked at the actual income distribution by percentiles and told them to stop.
When you break down the data, you see the clear distortion. The top 10% of households held the vast majority of the regional wealth. The remaining 90% of the population lived on wages that barely covered their monthly living costs.
This mid-premium grocery brand sold organic items, imported cheeses, and premium meats. Their target customer was the traditional middle class. But in that specific region, the middle class was a myth. The wealthy elite did not shop at mid-premium chains; they used private delivery services or niche boutique shops. The rest of the population could not afford a $10 jar of organic jam. Opening stores there would mean instant financial failure due to high corporate overhead and zero foot traffic from the middle segment.
The Economics of a Flat Wallet
Look at the real consumer. A worker in a high-inequality market looks rich on a global spreadsheet. If you convert his salary to Euros or Dollars, he looks like a solid target. But look closer at his actual monthly life. After rent, healthcare, insurance, transportation, and basic utility bills, his wallet is flat.
This consumer does not buy mid-tier brands. He cannot afford the luxury of being loyal to a middle-market product. He goes straight to hard discounters and private labels. He calculates every cent. If a private label detergent costs half the price of a branded mid-tier detergent, he buys the private label without thinking twice. He does not care about the heritage of your brand.
Meanwhile, the wealthy elite at the top of the Gini scale operate in a completely different economy. They do not care about inflation or small price changes. They only buy niche luxury, bespoke services, and ultra-premium products. They want exclusivity and status, not mass-market convenience.
The Barbell Effect in Retail
This dynamic creates a sharp and dangerous polarization in the consumer market, known as the “barbell effect.”
- The Luxury Wing (High Margin, Low Volume): Brands that cater exclusively to the top 1% to 5% of the wealth distribution. They possess high pricing power and excellent margins.
- The Discount Wing (Low Margin, High Volume): Hard discounters, dollar stores, and private labels that cater to the squeezed 90%. They survive purely on massive scale and extreme operational efficiency.
- The Dead Center: The traditional middle market where mid-tier consumer goods, standard supermarkets, and average-priced apparel brands live. This center is being completely crushed.
Strategic Conclusions for Brands
If you are managing a retail or FMCG brand, you must adjust your strategy to the actual income distribution:
1. Choose Your Side Safely
In high-inequality countries, the middle market is dying. You must choose a side. Go ultra-luxury or go hard-discount. Trying to sell to a non-existent middle class is financial suicide. If your product is positioned as “good quality for a fair price,” you are in the danger zone. The low-income consumer will find you too expensive, and the rich consumer will find you too cheap.
2. Compare Market Structures
Look at the variance between countries. On one side of the 2025 data, you have markets like Belgium at 0.46 and Slovakia at 0.38. On the other, you have Saudi Arabia at 0.78 and the US at 0.77.
Low Inequality (e.g., Slovakia: 0.38)     --> [ Solid Middle Class ] --> Mid-Tier Success
High Inequality (e.g., United States: 0.77) --> [ Wealthy Elite ] <---Gap---> [ Squeezed Workers ]
In Slovakia or Belgium, wealth is distributed more evenly. A factory worker and an office manager have different incomes, but they still shop in the same supermarkets and buy similar mid-tier brands. The consumer base is a solid block. In the United States, you cannot use that playbook. You are dealing with two entirely separate consumer universes inside one country.
3. Stop Trusting Aggregated Data
Never build a supply chain, a warehouse network, or a pricing strategy on average PPP alone. Look at the disposable income spread first. Break the market down into deciles. If the wealth is concentrated heavily at the top, adjust your store format, change your product portfolio, or stay out of the market completely.
There is a personal question for you: Where do you prefer to live and do business? In a country with high or low wealth inequality? Share your thoughts in the comments.


