
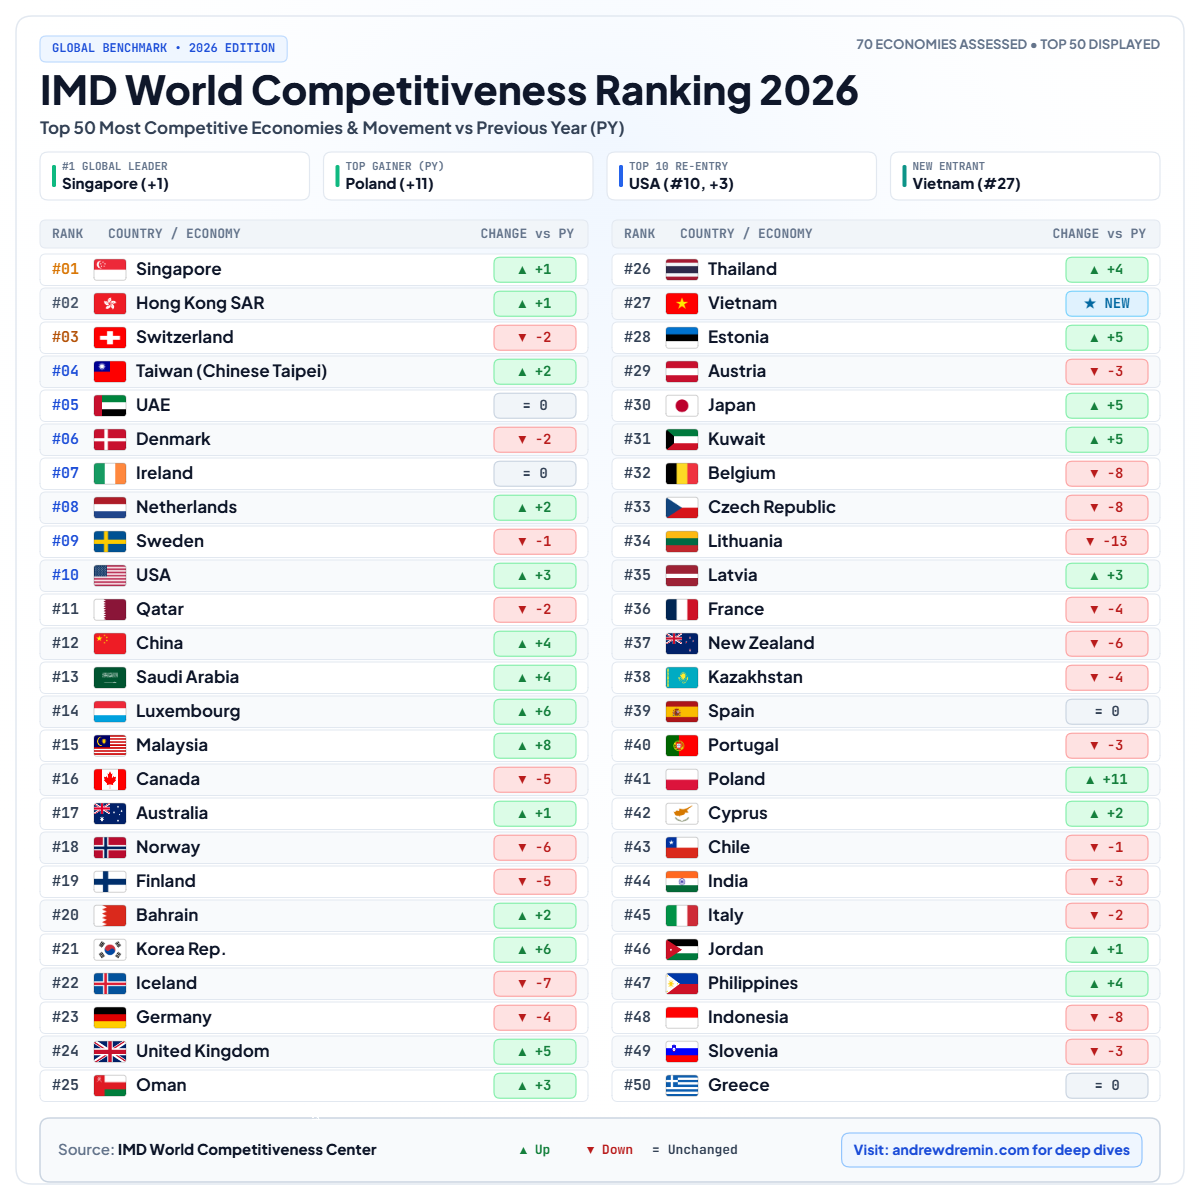
Vietnam entered the IMD World Competitiveness Ranking directly at #27. Poland jumped 11 spots to #41 as the top gainer of the year.
At the same time, traditional European powerhouses continued to slip down the chart. Germany dropped to #23 (-4), France fell to #36 (-4), Belgium dropped to #32 (-8), the Czech Republic slipped to #33 (-8), and Lithuania crashed 13 spots to #34.
Commercial directors, sourcing leads, and category managers often misread this data. They mistake absolute market size for commercial momentum.
Large economies still have volume, but operating there is becoming increasingly expensive, slow, and rigid. When a country drops in business competitiveness, it means higher operational friction, heavier regulation, and tighter margins for every business operating within its borders.
What the IMD World Competitiveness Ranking Actually Measures
The International Institute for Management Development (IMD) evaluates economies across four core pillars:
- Economic Performance: Domestic economy, international trade, foreign direct investment (FDI), and employment data.
- Government Efficiency: Public finance, fiscal policy, institutional framework, business legislation, and societal framework.
- Business Efficiency: Productivity, labor market flexibility, financial services, management practices, and executive attitudes.
- Infrastructure: Basic physical infrastructure, technology networks, scientific capability, health, and clean energy availability.
| Total Competitiveness | |
|---|---|
| Hard Data (67%) | Survey Data (33%) |
4 Core Pillars:
|
|
The ranking combines 67% hard statistical data with 33% executive survey responses. In practical terms, this benchmark does not measure wealth; it measures operational friction. It answers a simple commercial question: How easy and cost-effective is it to build, produce, hire, and run a profitable business here?
Decoding the 2026 Ranking: Key Movements and Market Shifts
The 2026 dataset shows clear regional divergences across Asia, North America, and Europe.
| Economy | 2026 Rank | YoY Change | Key Commercial Takeaway |
|---|---|---|---|
| Singapore | #01 | +1 | Reclaims #1 spot; lowest global operational friction. |
| USA | #10 | +3 | Re-enters Top 10 driven by tech investment and economic scale. |
| Malaysia | #15 | +8 | Fast-rising supply chain and manufacturing hub in Southeast Asia. |
| Vietnam | #27 | NEW | Direct entry above France, Japan, and Austria; major sourcing winner. |
| Germany | #23 | -4 | Slipped past Top 20 due to high energy costs, taxes, and bureaucracy. |
| Lithuania | #34 | -13 | Severe decline driven by labor shortages and regional security friction. |
| France | #36 | -4 | Rigid labor market, high state spending, and heavy retail regulation. |
| Poland | #41 | +11 | Top gainer globally; rapid industrial expansion and nearshoring growth. |
Sourcing Relocation: Why Vietnam Entered Directly at #27
Vietnam debuting at #27 is a major signal for global supply chain strategy. It entered the ranking ahead of mature economies like Austria (#29), Japan (#30), Belgium (#32), and France (#36).
| Manufacturing Competitiveness Hierarchy | ||
|---|---|---|
| Tier 1 | Singapore (#01) Taiwan (#04) | High-tech / Advanced Automation |
| Tier 2 | Malaysia (#15) Vietnam (#27) | Industrial Scale / Sourcing Hubs |
| Tier 3 | Germany (#23) France (#36) | High-Cost / Margin-Defense Zones |
This shift is not accidental. It is the result of long-term supply chain relocation:
- Supply Chain Diversification: Global brands have diversified production away from single-source dependencies. Vietnam is no longer just a secondary backup; it is an established primary manufacturing hub.
- Industrial Ecosystem Maturation: Ten years ago, Vietnam mostly offered basic assembly. Today, its tier-2 and tier-3 supplier networks (packaging, injection molding, component fabrication) are integrated and fast.
- Business and Trade Efficiency: Aggressive free trade agreements (such as the EVFTA with Europe and CPTPP across the Pacific) have eliminated tariff barriers that legacy markets still struggle with.
For procurement and category leaders, Vietnam represents production cost efficiency and trade agility.
Poland (+11) vs. Western Europe: Industrial Momentum vs. Legacy Friction
Poland was the top gainer in the entire 2026 report, climbing 11 places to #41. At the same time, core Western and Central European economies dropped significantly: Germany fell to #23, Belgium to #32, the Czech Republic to #33, and Lithuania dropped 13 places to #34.
| Poland’s Commercial Growth Engine | ||
|---|---|---|
|
Industrial Investment
|
High factory output & nearshore logistics | |
|
Real Wage Expansion
|
Higher disposable household income | |
|
Modern Retail Growth
|
Fast-moving consumer goods volume | |
Why is Poland moving up while Western Europe slides?
- Nearshoring Hub for Europe: European brands are shortening their supply chains. Poland has become the default production and logistics base for FMCG, consumer appliances, and automotive components serving the European Union.
- Modern Domestic Consumption: Poland is not just a factory floor; real wage growth has turned its domestic consumer market into an active volume driver for retail.
- The Western European Deadlock: In Germany and France, high energy tariffs, rigid labor rules, and heavy bureaucratic compliance create chronic margin pressure. Retailers cannot easily absorb these costs, so they pass the pressure directly to brand suppliers.
The Commercial Trap: Confusing Market Size with Growth Momentum
A recurring mistake in annual budget planning is allocating capital purely based on historical market size rather than forward momentum.
| Traditional Planning FLAWED | Momentum Planning AGILE |
|---|---|
|
80% Budget
StagnantLegacy Size
20% Budget
High-GrowthMomentum
|
50% Budget
MarginDefense
50% Budget
High-GrowthMomentum
|
Western European markets remain massive in total euro volume. However, modern FMCG retail in these markets has turned into a defensive battleground:
- Private Label Dominance: Hard discounters and major supermarket chains continuously expand private label market share (often exceeding 40–45% of category volume) to protect retail margins.
- Range Rationalization: Category buyers in France, Germany, and the Benelux region are actively cutting mid-tier “B-brands.” If a brand does not deliver top-tier rotation or high gross profit, it loses shelf space.
- Cost Absorption Failure: When energy, transport, and labor costs increase in high-friction markets, brands cannot pass those price increases to retailers without risking delisting.
Investing 80% of your commercial expansion budget into stagnant, high-friction markets funds historical inertia rather than real growth.
Strategic Playbook: 4 Actions for Commercial and Sourcing Directors
To align commercial strategy with global competitiveness realities, leadership teams should take four direct actions:
| Commercial & Sourcing Playbook | |
|---|---|
|
1
|
Segment Markets: Cash-Cow Defense vs. High-Growth Hubs |
|
2
|
Diversify Sourcing to Low-Friction Regions (Vietnam/Poland) |
|
3
|
Cut Category Complexity and Protect Retail Shelf Margins |
|
4
|
Track Total Cost of Ownership (TCO), Not Just Unit Price |
1. Treat Western Europe as a Margin-Defense Zone
Do not build aggressive volume-growth targets for low-competitiveness mature markets. Treat them as cash-generation and margin-protection zones:
- Defend core A-brand SKUs.
- Optimize trade promotions instead of increasing blanket marketing spend.
- Partner with retailer private-label programs where national brand margins are failing.
2. Move Production and Sourcing to High-Efficiency Hubs
Evaluate manufacturing footprints against competitiveness metrics. Sourcing from rising hubs like the Vietnam Sourcing Hub (#27), Malaysia (#15), or Poland (#41) lowers baseline unit costs and gives you pricing flexibility against discount retailers.
3. Simplify Category Assortments
High operating costs require lean category execution. Eliminate slow-moving inventory (long-tail SKUs) that ties up working capital in expensive European warehouses. Focus operational resources strictly on high-velocity items.
4. Recalculate Total Cost of Ownership (TCO)
Do not evaluate supply chains based solely on ex-works unit cost. Recalculate Total Cost Ownership (TCO) by factoring in: Country-level regulatory friction and compliance overhead. Lead-time volatility and logistics reliability. Local labor flexibility and tax structures.
- Country-level regulatory friction and compliance overhead.
- Lead-time volatility and logistics reliability.
- Local labor flexibility and tax structures.
A supplier in an economy with falling competitiveness often ends up costing more once delays, compliance charges, and energy surcharges are factored into the bottom line.
What is the IMD World Competitiveness Ranking?
Why did Vietnam rank higher than several Western European economies in 2026?
What does Poland’s jump to #41 mean for European consumer goods?
How should retail category managers use competitiveness rankings?
Related posts:
 OECD Pension Replacement Rates 2026: Spain 80% vs DE 42%
 GLP-1 Retail Market Trends 2026: Food vs Apparel Data
 Seasonal Retail Inventory Management: 85/15 Buffer Model
 Spain Grocery Market Share 2026: Why Giants Flatline
 Emerging Megacities: FMCG Retail Trends and Consumer Shifts by 2050
 Aldi vs Tesco Sainsbury Loyalty Schemes: 2026 Analysis
Leave a Reply