
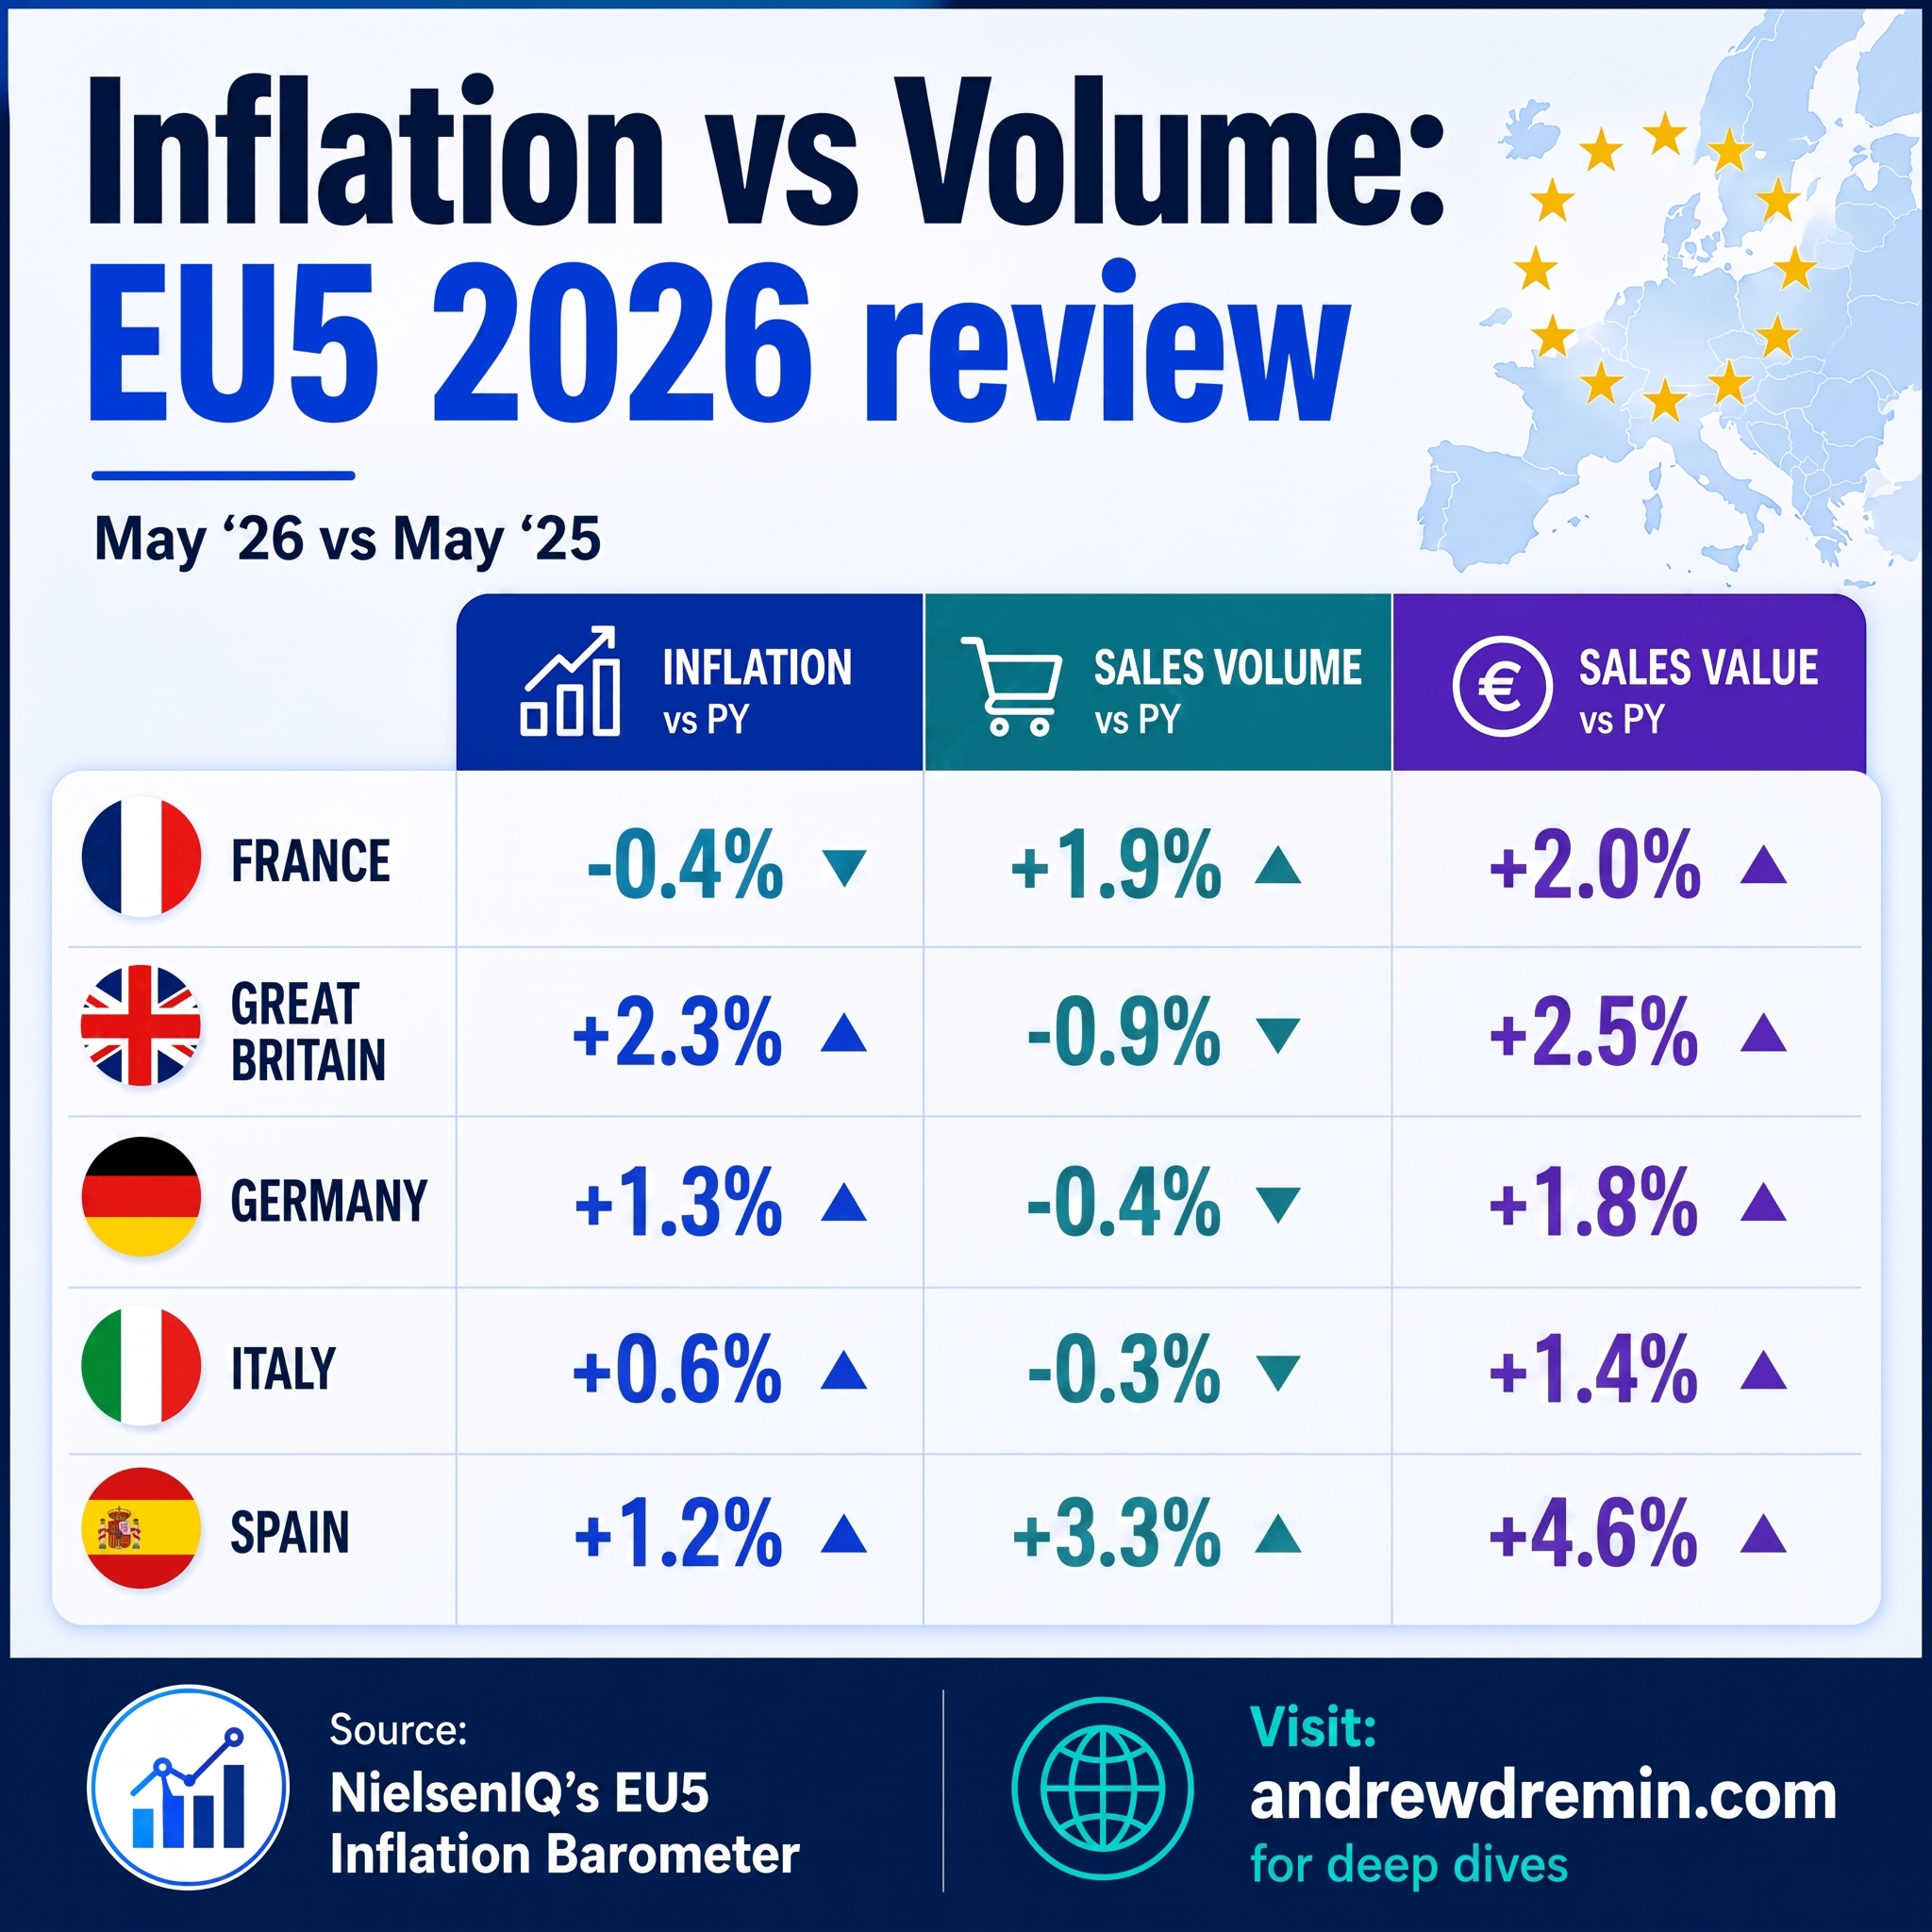
The European FMCG retail landscape in 2026 shows a sharp split between pricing policy and real volume demand. Across the EU5 economies – France, Great Britain, Germany, Italy, and Spain – headline value sales remain positive. However, looking beneath the top-line numbers reveals a different reality: unit volume growth is concentrated only in markets that brought inflation under control, while private label market share stalled across all five countries.
| Country | Inflation (vs PY) | Sales Volume (vs PY) | Sales Value (vs PY) | Brand Mix Shift |
|---|---|---|---|---|
| France | -0.4% | +1.9% | +2.0% | +0.5% |
| Spain | +1.2% | +3.3% | +4.6% | +1.7% |
| Germany | +1.3% | -0.4% | +1.8% | +0.4% |
| Italy | +0.6% | -0.3% | +1.4% | +1.4% |
| Great Britain | +2.3% | -0.9% | +2.5% | +0.7% |
France FMCG Inflation and Sales Volume Growth: The Deflation Playbook
France is the only major European market where FMCG shelf prices moved into negative territory. Supermarket price deflation of -0.4% acted as an immediate catalyst for real consumption recovery.
- Volume Performance: Physical volume increased by +1.9%, leading to total sales value growth of +2.0%.
- Price Dynamics: French retailers executed aggressive price resets on staple goods and non-food categories. Homecare shelf prices dropped by -1.9%, directly driving store footfall.
- Brand Development: National brand mix grew by +0.5%, while private label share remained flat.
When shelf prices stopped climbing, French consumers did not trade down to private labels. Instead, they returned to buying standard quantities of manufacturer brands. Retailers who cut shelf prices early preserved physical throughput in their supply chains and defended store traffic against discounters.
Spain Grocery Sales Volume and Inflation Growth: The Top Performer
Spain delivered the strongest volume and value performance among all EU5 nations. A controlled inflation rate combined with resilient domestic demand generated solid real growth across supermarket aisles.
- Volume and Value Growth: Physical sales volume jumped +3.3%, driving total FMCG sales value up +4.6%.
- Inflation Baseline: Grocery inflation cooled down to +1.2%, finding a sustainable equilibrium between retailer margins and shopper purchasing power.
- Brand Preference: Spain recorded the highest national brand mix growth in the EU5 at +1.7%.
Spanish consumers showed low price elasticity in non-discretionary sectors like healthcare (-0.90 elasticity). Rather than buying cheap store brands, Spanish households stayed loyal to established manufacturer brands once price hikes moderated. The market proves that keeping inflation near 1% restores real consumer purchasing confidence without hurting top-line revenue.
Great Britain FMCG Sales Value vs Volume Decline: The Top-Line Illusion
The British grocery market presents a deceptive picture. Value sales grew by +2.5%, but physical unit volume contracted by -0.9%. British top-line growth is driven by price hikes rather than actual demand.
- Artificial Revenue Drivers: The +2.5% value increase rests entirely on +2.3% inflation and a +0.8% buyer population increase. Real unit consumption per shopper dropped.
- Impulse Inflation: Non-alcoholic beverages saw steep price increases of +4.4%, pushing consumers away from frequent purchases.
- Extreme Price Elasticity: Alcohol elasticity in Great Britain reached -2.49. High baseline prices on beer, wine, and spirits caused immediate volume drops. In contrast, healthcare categories stayed resilient with an elasticity of -1.07.
Passing cost increases onto the consumer in the UK has reached a hard ceiling. Shoppers are pruning their baskets – buying their must-have manufacturer brands (brand mix +0.7%) while leaving secondary and impulse items on the shelf.
Germany Supermarket Inflation and Unit Sales Development: Persistent Caution
Germany remains stuck in negative physical volume territory despite moderate headline inflation. German shoppers remain defensive, prioritizing essential food purchases over discretionary spending.
- Volume vs Value Split: Sales value rose +1.8%, but physical volume dropped -0.4% under an inflation rate of +1.3%.
- Food vs Non-Food Imbalance: Food inflation remained high at +1.9%, absorbing household grocery budgets.
- Impulse Category Resistance: Confectionery prices jumped by +4.7%, triggering immediate volume resistance.
German consumers responded to high confectionery and food prices by cutting frequency. Despite intense discounter competition, manufacturer brand mix increased by +0.4%. German shoppers are not buying more private label; they are buying fewer units overall.
Italy FMCG Volume Sales and Category Pricing Trends: Moderate Stagnation
Italy kept grocery price inflation low at +0.6%, yet physical volume failed to return to positive territory (-0.3%). Italian consumers protected brand loyalty while adjusting non-food spending.
- Key Metrics: Sales value rose +1.4%, supported by a +1.4% increase in brand mix, while physical volume contracted by -0.3%.
- Non-Food Price Drops: Italian retailers cut healthcare prices aggressively by -3.9% to keep consumers in stores.
- High Alcohol Sensitivity: Italian alcohol price elasticity hit -2.62, making it the most price-sensitive beverage market in the EU5.
Italian households maintain strong loyalty to authentic manufacturer brands for cooking and daily meals. Price adjustments in non-food categories cushioned household spending, but high price sensitivity in impulse and alcoholic goods kept total unit sales slightly negative.
Cross-Country Analysis: Why Unit Volume Dictates Supply Chain Survival
Tracking FMCG growth through sales value alone hides severe operational risks. When value grows through inflation while unit volume shrinks, manufacturers and retailers face three critical structural problems:
1. Plant Capacity and Factory Overhead
A -0.9% volume drop in Great Britain or -0.4% in Germany means manufacturing plants run below optimal capacity. Fixed operating costs (machinery depreciation, labor, facility power) are spread over fewer physical units, increasing the cost of goods sold (COGS) per piece.
2. Transport and Logistics Inefficiencies
Freight costs do not drop when unit volume falls. Pallets and trucks move with lower product density, driving up logistics costs per case.
3. The Margin Reset Risk
When raw material costs decrease, retailers will demand price cuts. If a category manager relied solely on price inflation to hit revenue targets without securing unit volume, top-line sales and profit margins will fall rapidly.
Category Management Pricing and Volume Strategy for 2026
To rebuild unit volume and manage category profitability, commercial teams must adjust their category plans:
- Stop Uniform Price Increases: Differentiate pricing by category elasticity. Do not apply flat price hikes to high-elasticity categories like alcohol (-2.49 to -2.62).
- Fund Promotions That Move Units: Shift marketing funds from brand-building to promotional mechanics that drive physical cases through the checkout (multi-packs, volume discounts).
- Align Pricing with Category Role: Use price cuts in non-food and staple goods to defend store traffic, while protecting premium brand margins in low-elasticity categories like healthcare (-0.90 to -1.07).
- Eliminate Low-Velocity SKUs: Remove redundant middle-tier products that add operational complexity without delivering unit volume or brand loyalty.
Source: NielsenIQ’s EU5 Inflation Barometer
Frequently Asked Questions (FAQ)
Which European country had the highest FMCG volume growth in 2026?
Spain achieved the highest volume growth among the EU5 at +3.3%, supported by a moderate inflation rate of +1.2% and a strong sales value increase of +4.6%.
Why did France achieve positive volume growth while the UK saw volume decline?
France lowered supermarket prices by -0.4%, which restored consumer purchasing power and drove physical volume up by +1.9%. Great Britain maintained high inflation at +2.3%, causing physical volume to contract by -0.9%.
Did private label products gain market share in Europe in 2026?
No. Private label market share was flat or negative across all EU5 countries. Manufacturer brand mix grew in every major market: Spain (+1.7%), Italy (+1.4%), Great Britain (+0.7%), France (+0.5%), and Germany (+0.4%).
What is the operational impact of negative FMCG volume sales?
Negative volume sales reduce factory utilization, raise the fixed production cost per unit, create logistics inefficiencies, and leave suppliers vulnerable to revenue drops once price inflation ends.
Related posts:
 Spain Grocery Market Share 2026: Why Giants Flatline
 How Mercadona outperforms Carrefour through EDLP models and KVI consumer perception
 Emerging Megacities: FMCG Retail Trends and Consumer Shifts by 2050
 Aldi vs Tesco Sainsbury Loyalty Schemes: 2026 Analysis
 Global IQ Ranking by Country 2026: Top 50 Data Audit
 US Fast Food locations Rankings 2026: Chick-fil-A vs Subway Data
Leave a Reply