
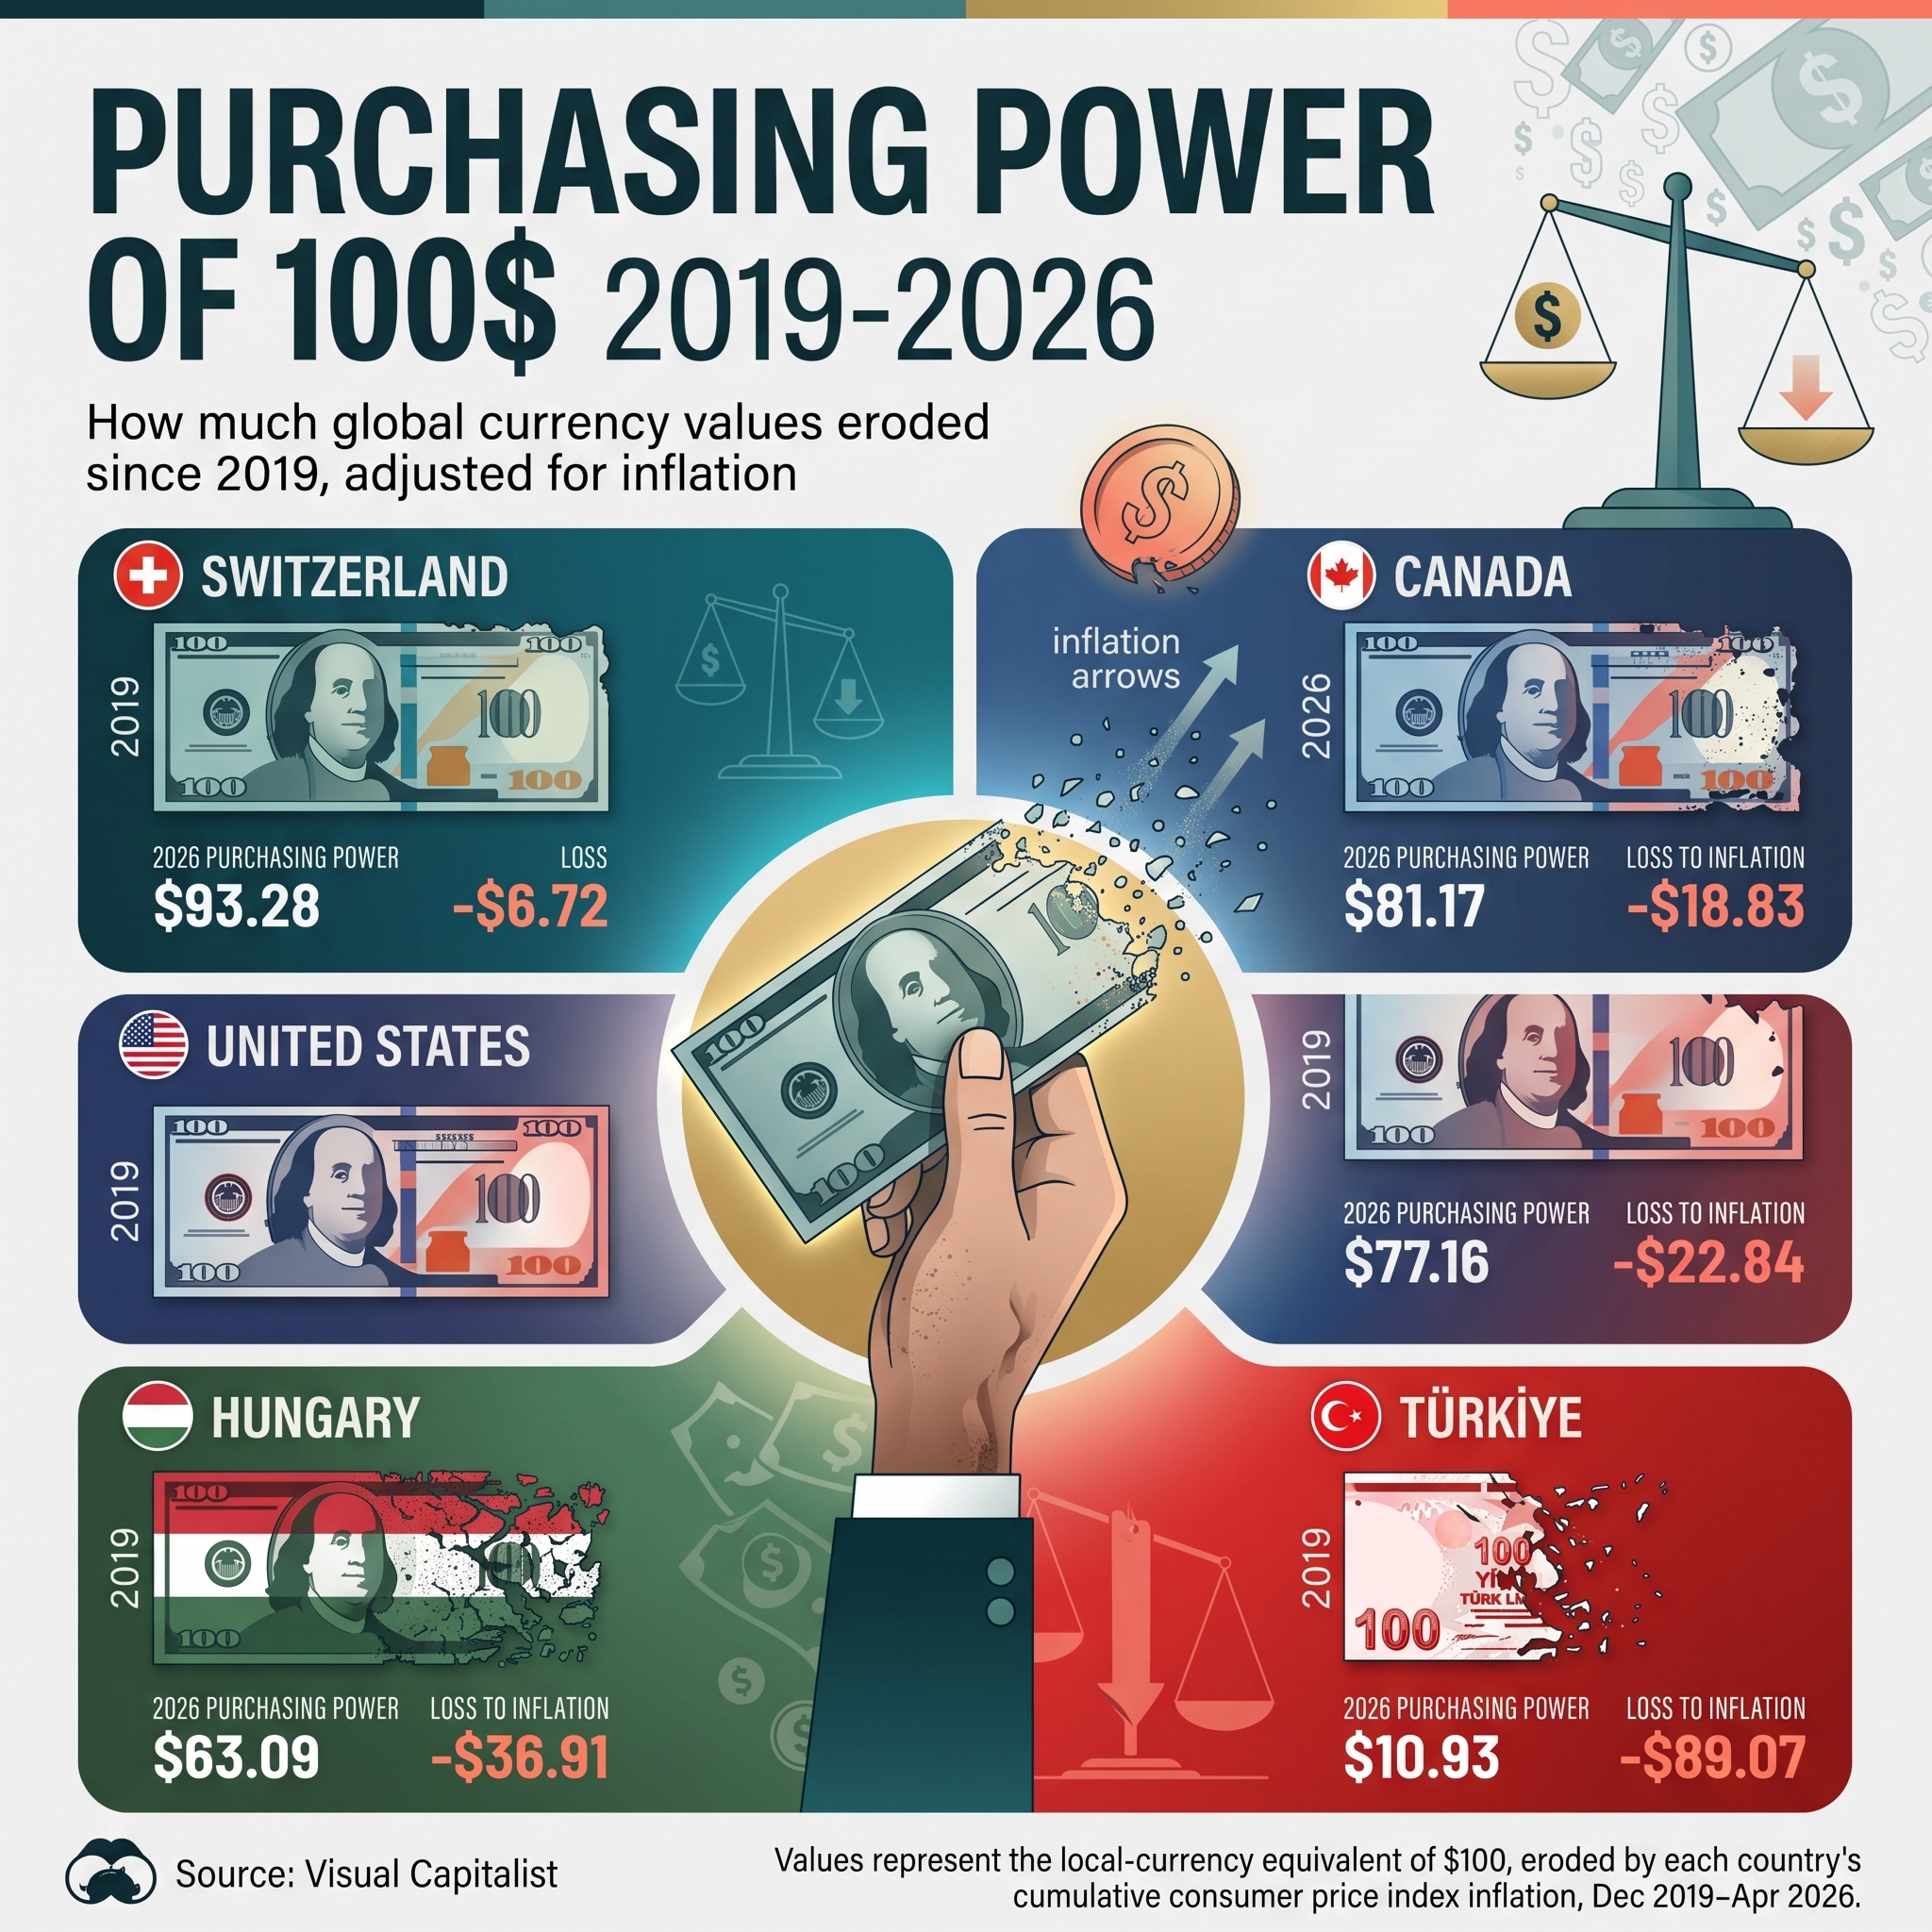
The purchasing power of a domestic currency equivalent to $100 in December 2019 changed drastically across OECD nations by April 2026. In Switzerland, that basket retained $93.28 of its value, whereas in the United States and the Netherlands it fell to $77.16. In Türkiye, high inflation reduced the domestic value of that initial $100 equivalent to just $10.93.
These headline Consumer Price Index (CPI) figures make for striking charts. However, relying on national CPI data to judge export competitiveness, supplier production costs, or cross-border procurement prices is fundamentally flawed.
Global Inflation Comparison (2019–2026): What CPI Data Actually Shows
The chart tracks cumulative consumer price index inflation to calculate how much local purchasing power remains from a baseline of $100 set in late 2019:

Purchasing Power of $100
Source: Visual Capitalist
Headline CPI measures the price changes of a standard retail shopping basket for local urban households – groceries, rent, local utilities, and personal services. It does not measure factory-gate prices, industrial input costs, currency dynamics, or cross-border trade margins.
Why Headline CPI Misleads Global Sourcing and Procurement Costs
Using consumer inflation metrics as a baseline for supply chain decisions or price negotiations creates severe blind spots. Four macroeconomic factors explain why CPI does not equal real procurement cost.
1. Real Wage Growth vs Consumer Inflation: The Income Factor
Consumer price growth without wage context is an incomplete metric. If consumer prices in a country increase by 22.84% over several years, but nominal wages rise by 25%, real consumer purchasing power remains stable.
- Static baskets ignore income adjustments: CPI measures cost increases assuming a fixed basket, but it ignores whether household incomes or industrial revenues kept pace.
- Labor cost divergence: In manufacturing, labor costs do not move in a 1:1 ratio with retail price inflation. In automated industries, labor is only 10% to 20% of the cost of goods sold (COGS). A supplier claiming a 20% price hike based strictly on national CPI is often protecting or expanding their margin.
2. Currency Depreciation vs Domestic Inflation: The Turkish Sourcing Case
In the visual comparison, Türkiye experienced an 89.07% drop in the domestic purchasing power of its currency. An inexperienced category manager might assume that sourcing from Türkiye became ten times more expensive.
In international trade, the opposite often happens due to foreign exchange depreciation:
- The FX offset: While domestic prices in Turkish Lira surged, the Turkish Lira depreciated substantially against the US Dollar and the Euro over the same period.
- Export pricing dynamics: When local currency depreciation outpaces domestic industrial inflation, export pricing in USD or EUR can decrease or remain flat for international buyers.
- Imported input dependency: The real price driver for Turkish exporters is not local consumer food prices; it is the cost of imported raw materials, imported machinery, and energy billed in hard currency.
3. The Swiss Franc Paradox: Low Inflation vs High Export Costs
Switzerland leads the OECD index, losing only $6.72 of its purchasing power ($93.28 retained). This stability is beneficial for Swiss residents buying imported goods. For international procurement teams, however, sourcing Swiss goods became significantly more expensive.
- Safe-haven currency pressure: The Swiss Franc (CHF) appreciated steadily against both the Euro and the US Dollar.
- The exporter disadvantage: Even with minimal domestic inflation, currency appreciation increases the cost of Swiss goods on foreign shelves. Low domestic CPI does not equal cheap export pricing.
4. Government Subsidies and Price Controls Skew National CPI
The inflation numbers across European nations show wide divergence due to government market interventions:
- Energy shields and price caps: Countries like France ($84.89) and Spain ($80.52) implemented state subsidies, tariff freezes, and energy caps to keep consumer inflation artificially lower on paper. The underlying costs were absorbed through national debt.
- Direct market exposure: Nations in Eastern Europe and the Baltics – such as Estonia ($66.14), Lithuania ($66.27), and Hungary ($63.09) – allowed global energy and food market shocks to pass directly to retail shelves, creating higher recorded CPI numbers.
- Industrial reality: Factories in subsidized markets still face regulatory fees, corporate tax increases, and production overheads designed to recover state spending.
Strategic Metrics for Category Managers: What to Track Instead of CPI
To manage contracts and evaluate supplier pricing, procurement teams must replace general CPI references with industrial-grade economic indicators.
| Strategic Metric | Practical Procurement Use Case |
|---|---|
| Real Effective Exchange Rate (REER) | Measures trade competitiveness by adjusting nominal exchange rates for inflation differentials. |
| Producer Price Index (PPI) by Industry Sector | Tracks price changes from the seller’s perspective, isolating factory-gate and raw material changes. |
| Clean ‘Should-Cost’ Cost Breakdown | Unbundles material, labor, energy, transport, and fixed overhead into separate cost drivers. |
| Landed Cost Model | Combines ex-works unit cost with maritime freight, customs duties, currency fees, and port handling. |
- REER Analysis: If a supplier’s country has high inflation but an even faster currency devaluation, its REER drops, indicating the supplier has room to offer competitive export pricing.
- Sector-Specific PPI: Never accept a price increase based on national CPI. Require suppliers to benchmark against relevant commodity indices (e.g., metals, polymers, pulp) or specific manufacturing PPI sub-indices.
Step-by-Step Guide: How to Negotiate Supplier Price Hikes Using Inflation Data
When a supplier uses broad national inflation headlines to demand price increases, apply this systematic approach:
- Deconstruct the Cost Sheet: Require the supplier to split their cost structure into percentages: Raw Materials (%), Direct Labor (%), Industrial Energy (%), Logistics (%), and Margin (%).
- Isolate Currency Exposure: Identify the currency in which raw materials are purchased. If a supplier operates in a high-inflation market but buys raw materials in USD, only local conversion and direct labor are tied to the local economy.
- Audit Energy Inputs: Separate regulated grid costs from volatile spot market fuel costs. Verify whether state subsidies reduced their industrial utility expenses.
- Implement Indexation Clauses: Replace flat annual price adjustments with dynamic mathematical formulas tied to independent commodity and currency benchmarks rather than retail price indices.
Using headline consumer inflation to evaluate commercial contracts distorts real market conditions. Sustainable procurement relies on production cost fundamentals, exchange rate dynamics, and verifiable factory-level cost structures.
Frequently Asked Questions (FAQ)
What is the main difference between CPI and PPI in global sourcing?
Why does a falling domestic currency protect foreign buyers from local inflation?
What is Real Effective Exchange Rate (REER)?
Why did Eastern European countries record higher purchasing power loss than Western European nations?
Related posts:
 Global IQ Ranking by Country 2026: Top 50 Data Audit
 Spain Grocery Market Share 2026: Why Giants Flatline
 Aldi vs Tesco Sainsbury Loyalty Schemes: 2026 Analysis
 Emerging Megacities: FMCG Retail Trends and Consumer Shifts by 2050
 How Mercadona outperforms Carrefour through EDLP models and KVI consumer perception
 US Fast Food locations Rankings 2026: Chick-fil-A vs Subway Data
Leave a Reply